Today I would like to share with you a fascinating story about using Qlik Sense to analyse a bank’s loan portfolio. This project was not just a challenge for us, but an opportunity to open up new horizons in the use of data analytics.
Key participants in the project
We started working on this project in collaboration with one of the banks, and immediately attracted the attention of several of its departments. The main stakeholders included the retail lending department, the corporate lending department, and the planning and economics department, which needed to assess balance sheet performance and the bank’s ability to manage its assets.
Data: from 1.5TB to 400GB
Our initial data consisted of a 1.5 TB Microsoft database. However, after an initial analysis, we realised that the data we really needed was only 400 GB. This data was a three-year retrospective and contained key indicators of the loan portfolio, including disbursements, repayments and related loan agreements.
Depth of analysis: tracking all tranches
These 400 gigabytes of data allowed us to fully track all the tranches the bank issued to the borrowers, which were repaid as interest and principal.
As part of the portfolio analytics, we also analysed the delinquency parameters. This was necessary because some borrowers did not always fulfil their obligations on time, which led to delays in interest and principal repayments.
Accounting for collateral and provisions
An important aspect of our analysis was also accounting for the collateral that had been generated as part of the loan agreement and assessing the allowances that the bank had to make based on the client’s initial scoring and accounting for the category of indebtedness.
In conclusion, our work on loan portfolio creation and analysis using Qlik Sense enabled the bank to manage its assets more efficiently, and to improve its work with clients.
Migration and Adaptation: The Evolution of Qlik Use
We started our work using QlikView – it was the previous version of the Qlik platform, which even then provided a powerful set of tools. But as they say, to stand still is to move backwards. As the customer developed internal analytics, the needs became more complex and diverse.
From QlikView to Qlik Sense
It was time to look to the future. The decision to migrate from QlikView to Qlik Sense was driven by a desire to give users more options for working with data themselves.
- Flexibility: Qlik Sense allows users to easily design their dashboards and customize the visual representation of data.
- Self-service: Supports a self-service concept that allows business users to create their own analytical tools.
- Security: The platform provides flexible access control at the data source and visualization level.
Migration Results: Quantitative and Qualitative Growth
The migration was successful, and the results exceeded our expectations. The number of users active in analytics increased tenfold!
If initially only 15 users worked on QlikView, after migration to Qlik Sense, more than 150 users in different departments of the bank are actively involved in analytical activities.
Most of these users are not just involved in reviewing reports, but in in-depth analytics, constructing and optimizing analytical processes.
Ahead of the Opportunity Only
Now that we have a more powerful and flexible platform in the form of Qlik Sense, there are endless possibilities ahead to improve the bank’s analytical processes. This journey is just beginning.
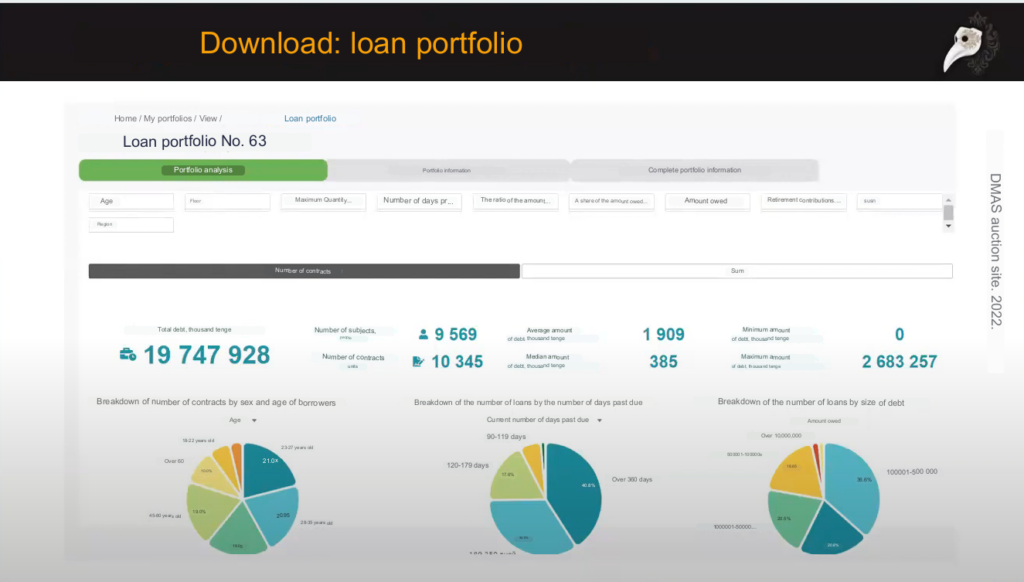
Turbocharging the data: How to speed up the downloading process?
But let’s not get ahead of ourselves and get back to downloading data. Imagine this: 400 gigabytes of loan portfolio information is like a library overflowing with books! We needed to ensure that this mass of data was efficiently delivered to Qlik Sense.
Our Qlik ship was ready to take on board this load, and we used parallel loading. Like a Swiss watch, Qlik Sense handled multiple data streams with ease, allowing us to reduce our loading time.
It was important not only to load the data, but also to keep it up to date. We implemented an incremental loading mechanism that updated the data daily, like a conscientious gardener watering his plants.
Attention to Details: Overdue and Issue
Now, with up-to-date data on board, we could proceed with a more in-depth analysis of the loan portfolio.
It is important not only to look at the principal but also to consider the interest.
Delinquency analysis allows the bank to take timely action and minimise risk.
- Estimation of lending and repayment volumes
- These indicators have a direct impact on the volume of assets in the loan portfolio.
- They allow us to understand how the loan portfolio reacts to external and internal factors.
- Delinquency analysis
- It is important not only to look at the principal but also at the interest.
- Delinquency analysis allows the bank to take timely action and minimise risk.
Online or Offline: Promptness vs Depth of Analysis
At this point, we are faced with a question: how important is operational analytics in a near online mode? Should we chase ultra-relevant data or should we focus on in-depth analysis of the loan portfolio based on the facts already obtained? This choice in each case will depend on the specifics of the bank and its business processes.
Picture of the World in Figures and Graphs: A View through the Qlik Sense Prism
We present a kind of “art” – analytics in Qlik Sense. Let’s imagine that our graph is a canvas and the data is the paints we use to create the overall picture.
- Delinquency: Hidden Potential or Lost Profit?
- Even if the amount of overdue interest seems insignificant, it should not be forgotten that this is a lost profit for the bank.
- It is worth paying attention to this indicator in order to identify “hidden” potential gains.
- Collateral: The Bank’s Protective Shield
- Collateral will allow the bank to protect itself against potential or actual losses that may occur if the loan is not repaid.
- This indicator becomes especially important when analysing the risk of loan default.
- Weighted Average Rate: The Price of Money.
- This ratio measures the “price” of money that a bank “charges” borrowers.
- Furthermore, it shows how much the bank’s rate exceeds the refinancing rate and whether the bank is able to turn to the interbank market for additional funds if needed.
- Reserve estimates: The bank’s safe haven
- The analysis of provisions helps to assess which provisions the bank has made for various categories of debt.
- Particular attention should be paid to the bank’s compliance with the regulator’s provisioning requirements. This analysis allows the bank to be aware at all times and prevent possible irregularities.
To sum up, Qlik Sense dashboard provides a complete and objective view of the current state of the bank’s loan portfolio, which allows you to respond to changes in a timely manner and make informed management decisions.
Breakthrough in Convenient Analysis: the Associative Model in Qlik Sense
Qlik Sense is more than just an analytical tool. It is a tool that brings transparency and simplicity to the data analysis process. Let’s break it down with a concrete example.
- Flexible filters.
- The user can easily filter the data by desired reporting period, choose the type of loan purpose of interest, or even sift out information by specific branch.
- Additionally, Qlik Sense provides the ability to select a specific borrower for detailed analysis.
- Associative Model: Tracing Linkages Between Data
- The associative model allows users to get transparent data linkage traceability already at the filtering stage.
- Suppose we are interested in a loan with a term of 3-5 years and a maximum possible rate. Using the “rule of three colours”, we can immediately see which branches work with such loans, who are the consumers of these loans and in which currencies they are issued.
- Green indicates the categories or “slice” of data we are interested in.
- White reflects the data that is related to our choices and that fell into our sample.
- Grey shows data that are outside our sample.
As a result, without even embarking on a detailed analysis of volume metrics, metrics, performance estimates and dynamics, we can already get answers to key questions. And it’s all thanks to the unique associative model in Qlik Sense, which significantly speeds up the data analysis process.
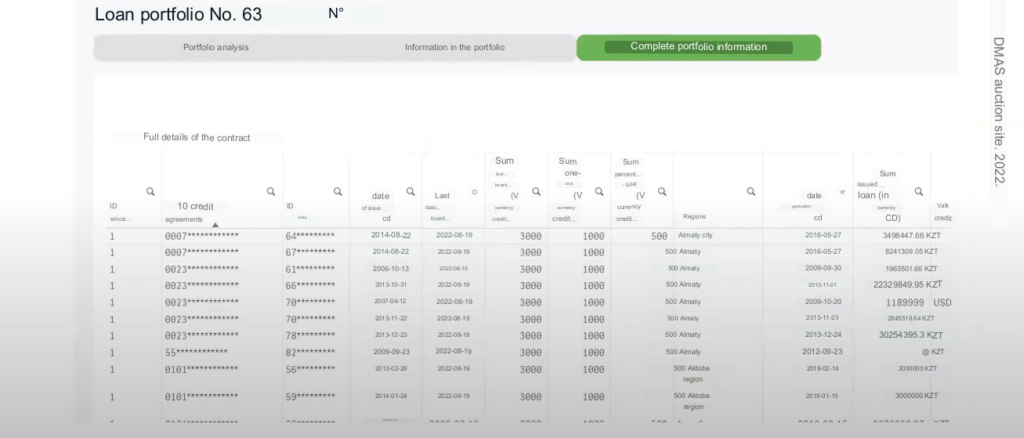
Detailed Credit Portfolio Analysis with Qlik Sense
Continuing our work with Qlik Sense, we move on to more detailed analysis. The first step is plan-fact and like-for-like analysis.
First, we look at how successful the branch is in executing its plan.
Next, we assess the dynamics relative to the percentage of plan implementation.
And finally we look at the waterfall graph, which shows the actual contribution of each branch to the overall plan.
Additionally, Qlik Sense allows us to see the dynamics over different reporting periods, mark periods with drawdowns or, conversely, over-achievement of the plan.
A similar approach is used for year to year analysis, allowing you to evaluate the performance of your branch network.
You can view the evolution of the loan portfolio for each branch by comparing the current year to the previous year.
We proceed with a more detailed analysis starting with the loan portfolio dynamics, its structure and the construction of the ratings, if necessary, for the different business objects.
We also analyze the issuance and repayment of loans and take a detailed look at overdue loans.
We assess the dynamics in line with the bank’s strategy of increasing the loan portfolio for specific purposes and reducing short-term borrowing.
All this data is clearly presented in graphs and charts.
So, we see that Qlik Sense provides us with ample opportunities for detailed data analysis and visualization, making the process of loan portfolio analysis more efficient and visual.
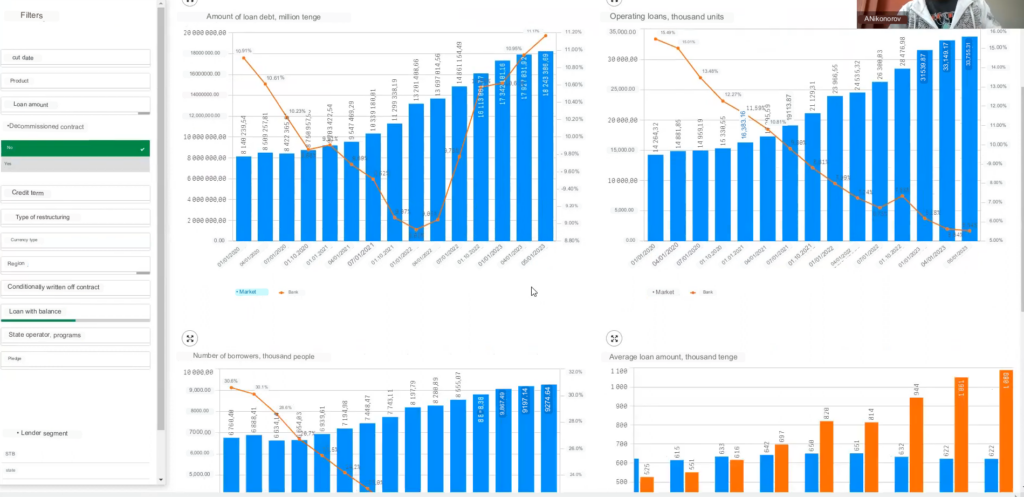
Loan Structure Analysis and Forecasting
Since the beginning of the year, we see that most of the lending has been in long-term borrowings. This trend has continued throughout the year and we have seen a steady growth in long-term loans.
This chart shows the ratio of loans to loan repayments. This tool allows you to see the effect of the loans issued and repaid on the performance of your loan portfolio.
This type of analytics is actively evolving towards forecasting. We have schedules of scheduled repayments and disbursements which allow us to assess how plans may affect the total loan portfolio. If we look at the outlook over the next six months or 18 months and notice that the loan portfolio is shrinking, this becomes a signal to management to develop new potential deals.
Financial Analysis of the Loan Portfolio
In addition to the overall analysis of the loan portfolio, we have performed a financial result analysis. Here we estimate the amount of credit margin that is generated by the loan portfolio on a monthly basis.
We also estimate the amount of net margin, taking into account some of the bank’s unregulated expenses related to the servicing of the loan portfolio. We also take into account the additional amount we pay for the use of capital in order to comply with regulatory requirements.
All of this analysis allows us to come out with an estimate of our net margin and assess the overall performance of our assets and how they are generating income for us.
This part of the analysis focuses on assessing the absolute result. Here we see how the financial result has changed over time, in absolute terms across the portfolio, as well as the contribution of each branch to the formation of this result.
Parsing the structure of the loan portfolio: An in-depth look
The main purpose of the loan portfolio structure analysis is to assess its volume at a given date in terms of different purposes and types of lending, terms and branch network.
It is important to note that we apply multi-level analysis, which helps us to assess the volume of the loan portfolio by different types of loans, by interest rates and by bank branch network.
So, we see that the main share of the loans we make are at 7%, but a significant proportion are also loans at a higher rate of 9%.
It is worth noting that the bank has started experimenting with multivariate analytics in terms of evaluating branch performance. The aim is to compare on a single chart the volume of the loan portfolio and the weighted average rate at which the branch is lending.
It is important to understand that with high lending volumes and a high rate, a branch will be more efficient than any other branch, even taking into account operating and non-operating costs, various deductions for risk, capital charges and the like.
An important point is the evaluation of the branch network. Here we use the so-called “Bubble Chart”, which allows us to rank any business entity by the volume of the loan portfolio, the efficiency of the management of this portfolio and the weighted rate.
This allows us to see that, for example, a certain Branch is the most efficient – it has a large loan portfolio and a high financial result. And another branch, although it has an impressive loan portfolio, does not provide the same high efficiency, because its financial result is significantly lower.
Thus, thanks to the use of Qlik Sense for analyzing the bank’s loan portfolio, we can perform a more detailed and in-depth analysis that allows us to make more informed and effective management decisions.
Borrower rating: the essence is in the details
Borrower rating is also an important part of our analysis. We rank them all by a set of key metrics, with the ability to dynamically change these metrics as needed.
Instead of a financial outcome, for example, you could use credit margin, asset size, or risk-weighted assets – it all depends on your analysis objective and data interpretation.
Loan disbursement and repayment: in active drafting
Our next section on loan disbursement and repayment is still under active development. However, interesting aspects can already be mentioned.
Distribution of loans and repayments: We are working with our colleagues on analyzing the distribution of loans and repayments across various analytical slices. The aim is to assess the effectiveness of the various issuance and attraction channels as well as the bank’s marketing campaigns.
As we do not yet have data on channel efficiency, we have focused on the branch cut, including rates, currencies and loan types.
By visualising the data in Sunkey’s chart, we can see which branch is the leader in terms of loan volume, what rates and currencies are used, and how these funds are allocated to different lending targets. This visualisation allows users to quickly rebuild the data by assessing the performance of different policy slices. For example, we have found that the 7% interest rate is the most common because it includes the largest proportion of our loans.
Rate and delinquency analysis: expanding our research area
As part of our loan origination analytics, we looked deeper into rates such as 9%, 8.5%, 8% and so on. This allowed us to see the distribution of issuance and asset management in these categories. Next, we analysed the volume of delinquencies, comparing them to the total loan portfolio. We looked at the structure of overdue principal and interest payments and also analysed provisioning for different categories of problem debt and compliance with the regulator’s mandatory provisioning requirements to cover potential losses.
We also looked at the branch structure to assess provisioning by category of delinquency and even fell back to specific borrowers to understand the extent to which each branch has made the necessary provisions to minimise the risks of managing its loan portfolio.
Prospects for the development and use of the toolkit
This loan portfolio analysis toolkit is used on both workstations and mobile devices, providing a wide user reach within the bank. It is the most user-friendly and functional case study for loan portfolio management. We understand that the tool will evolve further.
Our colleagues are currently actively exploring the possibility of transaction modelling. They are interested in assessing what impact the inclusion of a potential new deal with a certain client will have on the size of the loan portfolio and its margins. The modelling takes into account parameters such as deal volume, rate, potential margin, required provisions and so on. All of this is incorporated into our model to predict loan portfolio values for the branch, the bank as a whole or for a particular borrower.