BI systems demos and trial versions
Qlik Sense setup latest (Windows x64)
Qlik Sense offers modern analytics that empowers users at all skill levels to uncover insights and trigger actions when it matters. Go beyond the dashboard.
Tableau setup latest (Windows x64)
Learn about the Tableau products that can help you connect to data, create a visualization and share your findings in minutes.
Microsoft Power BI latest (Windows x64)
Power BI is a technology-driven business intelligence tool provided by Microsoft for analyzing and visualizing raw data to present actionable information. It combines business analytics, data visualization, and best practices that help an organization to make data-driven decisions.
Vizlib latest
Vizlib is an indispensable part of your data analytics strategy, inspiring you to deliver on the reality for better BI from Qlik Sense and in the Qlik Cloud. Includes Vizlib Library, Vizlib Live, Vizlib Self-Service, Vizlib Server, Vizlib Collaboration, Vizlib Finance, Vizlib Gantt.
Books and manuals
Qlik Sense
Qlik Sense®: The Official Guide – Second Edition: Get the most out of your Qlik Sense investment with the latest insight and guidance direct from the Qlik Sense team 2nd Edition
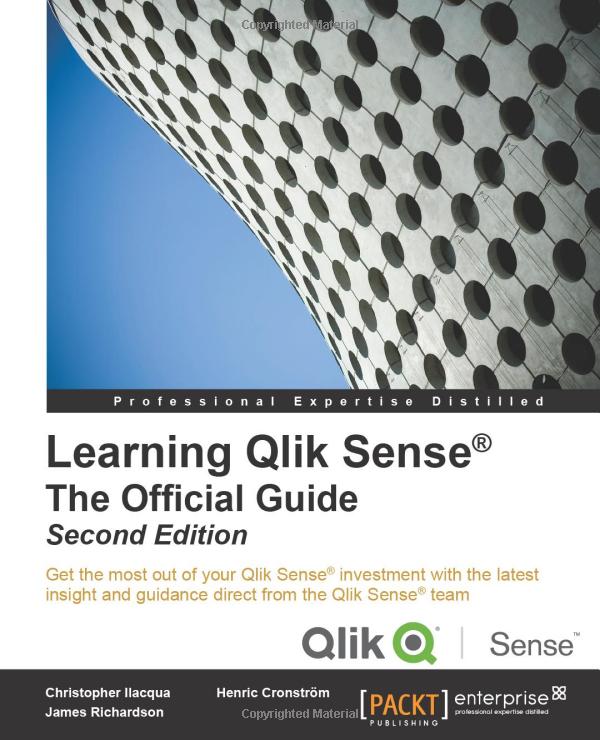
Get the most out of your Qlik Sense investment with the latest insight and guidance direct from the Qlik Sense team
About This Book
- Updated with new coverage on Qlik Cloud, Qlik Sense Modeling, and Extending the Qlik Analytic Platform.
- Get insider insight on Qlik Sense and its new approach to business intelligence.
- Explore practical demonstrations for utilizing Qlik Sense to discover data for sales, human resources, and more.
Who This Book Is For
Learning Qlik Sense®: The Official Guide Second Edition is for anyone seeking to understand and utilize the revolutionary new approach to business intelligence offered by Qlik Sense. Familiarity with the basics of business intelligence will be helpful when picking up this book, but not essential.
What You Will Learn
- Understand the vision behind the creation of Qlik Sense, and the promise that data discovery offers to you and your organization
- Get to grips with the life cycle of a Qlik Sense application
- Load and manage your data for app creation
- Visualize your data with Qlik Sense’s engaging and informative graphing
- Administer your Qlik Sense system and monitor its security
- Build efficient and responsive Associative Models
- Extend the Qlik Analytic Platform with the Dev Hub
- Optimize Qlik Sense for sales, human resources, and demographic data discovery
In Detail
The intuitive and powerful Qlik Sense visual analytics software allows anyone to engage in data discovery, to explore your data, and find meaningful insights to empower your business. Qlik Sense lets you easily create personalized reports and visualizations and reveal essential connections to show new opportunities from every angle.
Written by members of the Qlik Sense team, this book is the official guide from Qlik to understanding and using their powerful new product with fully updated coverage to the latest features of the most modern edition of Qlik Sense. Benefit from the vision behind the development of Qlik Sense and get to grips with how Qlik Sense can empower you as a data discovery consumer. Learn how to create your own applications for Qlik Sense to customize it to meet your personal needs for business intelligence, and how to oversee and administer the Qlik Sense data architecture. Finally, explore utilizing Qlik Sense to uncover essential data, with practical examples on finding and visualizing intelligence for sales figures, human resources information, travel expense tracking, and demographic data discovery.
Style and approach
This book is a practical guide to understand what Qlik Sense is and how to implement it. This is an example-rich, step-by-step book to implement and optimize Qlik Sense for sales, human resources, and demographic data discovery.
Qlik Sense for Beginners
Want to learn Qlik Sense? Do you want to learn the next generation of data visualization software called Qlik Sense?
Start to explore your data with personalized visualizations…
Business intelligence has changed a lot in recent years and qlik have provided a revolutionary product to meet these changes head on. Qlik Sense will allow you to create dynamic dashboards to explore data in ways you didn’t think were possible.You will be able to analyse your data so you can make informed decisions that help you reach your goals.With the book ‘Qlik Sense for Beginners’ you’ll discover a step-by-step concise approach to learning Qlik Sense.
Inside this book you’ll discover:
- How to get started with Qlik Sense from installation to creating your first app.
- How to read different data sources such as Excel, Access Data or simply text files into your app.
- How to create various charts and tables in Qlik Sense for example bar, gauges, line, combo, treemaps and scatter plots.
- How to manage the data in your Qlik Sense app.
After the basics you’ll learn:
- Pivot tables
- Development Techniques – for example subroutines, external scripts and crosstables
- Advanced Functions such as Class, Intervalmatch, Dual and more
- Set analysis and Inner Joins
- QVDs and Incremental loads
- Bookmarks
- Storytelling
- Qlik Sense Extensions
- Maps
- And much more…
Learning Qlik Sense: The Official Guide
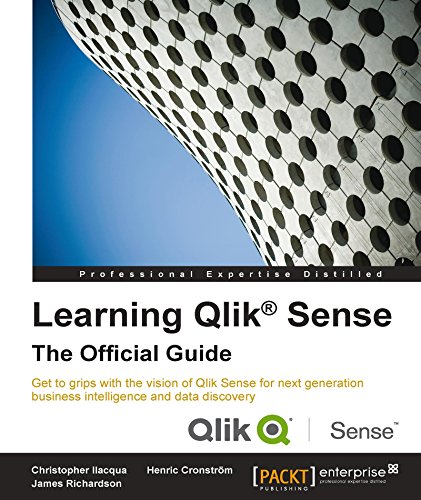
Get to grips with the vision of Qlik Sense for next generation business intelligence and data discovery
About This Book
- Get insider insight on Qlik Sense and its new approach to business intelligence.
- Create your own Qlik Sense applications, and administer server architecture.
- Explore practical demonstrations for utilizing Qlik Sense to discover data for sales, human resources, and more.
Who This Book Is For
Learning Qlik® Sense is for anyone seeking to understand and utilize the revolutionary new approach to business intelligence offered by Qlik Sense. Familiarity with the basics of business intelligence will be helpful when picking up this book, but not essential.
What You Will Learn
- Understand the vision behind the creation of Qlik Sense, and the promise that data discovery offers to you and your organization.
- Get to grips with the life cycle of a Qlik Sense application.
- Load and manage your data for app creation.
- Administer your Qlik Sense system and monitor its security.
- Visualize your data with Qlik Sense’s engaging and informative graphing.
- Build your own applications, from data import through to publication.
- Optimize Qlik Sense for sales, human resources, and demographic data discovery.
In Detail
The intuitive and powerful Qlik Sense analytics software allows anyone to engage in data discovery, to explore your data and find meaningful insights to empower your business. Qlik Sense lets you easily create personalized reports and visualizations, and reveal essential connections to show new opportunities from every angle.
Written by members of the Qlik Sense team, Learning Qlik® Sense is the official guide from Qlik to understanding and using their powerful new product. Benefit from the vision behind the development of Qlik Sense and get to grips with how Qlik Sense can empower you as a data discovery consumer. Learn how to create your own applications for Qlik Sense to customize it to meet your personal needs for business intelligence, and how to oversee and administer the Qlik Sense data architecture. Finally, explore utilizing Qlik Sense to uncover essential data, with practical examples on finding and visualizing intelligence for sales figures, human resources information, travel expense tracking, and demographic data discovery.
Qlik Sense Desktop – Conceitos Básicos (Portuguese Edition), Kindle Edition
O livro Qlik Sense Desktop – Conceitos Básicos foi escrito para que você em poucos minutos entenda o funcionamento da ferramenta Qlik Sense Desktop e através de passos simples e rápidos aprenda a utilizá-lo
Separei o livro em cinco capítulos essenciais:
- Capítulo 1: Uma rápida introdução ao Qlik Sense, requisitos mínimos de sistema, instalação do Qlik Sense Desktop e o download da base de dados de exemplo.
- Capítulo 2: Neste capítulo você entenderá como funciona o Qlik Sense Desktop, conhecerá as principais telas da ferramenta, aprenderá o que é uma visualização e quais os tipos de gráficos disponíveis no Qlik Sense Desktop.
- Capítulo 3: No capítulo três você descobrirá e aprenderá o segredo que existe por trás de um app Qlik Sense: as cargas de dados, a transformação dos dados e o modelo de dados.
- Capítulo 4: No capítulo quatro é onde a mágica acontece. Neste capítulo você aprenderá a criar dashboards, gráficos, expressões, medidas, tabelas, filtros reutilizáveis e o interessante gráfico Map.
- Capítulo 5: Aqui você aprenderá a criar e a usar a nova função Storytelling. Através de capturas de imagens de determinadas visualizações você poderá realizar apresentações, ou contar uma história, de um determinado produto ou cliente sem precisar sair do Qlik Sense Desktop.
Ao final do livro você terá desenvolvido três dashboards completos além de ter aprendido a carregar dados para o app, criado os gráficos de pizza, barras, linhas, combinado, treemap, dispersão, mostrador, tabela, texto e imagem e os novos itens Map e Storytelling… E MUITO MAIS!!!
O livro inclui mais de 170 imagens com exemplos!!!
Este é o primeiro livro lançado no mundo sobre a nova ferramenta de Business Intelligence, o Qlik Sense Desktop.
Mastering Qlik Sense: Expert techniques on self-service data analytics to create enterprise ready Business Intelligence solutions
Master the capabilities of Qlik Sense to design and deploy solutions that address all the Business Intelligence needs of your organization
Key Features
- Create compelling dashboards and visualizations with your data by leveraging Qlik Sense’s self-service model.
- Perform data loading and model efficient solutions with faster performance and better governance.
- Master Qlik Sense’s APIs and develop powerful mashups and fantastic extensions for visualizations and other components that run across all platforms.
Book Description
Qlik Sense is a powerful, self-servicing Business Intelligence tool for data discovery, analytics and visualization. It allows you to create personalized Business Intelligence solutions from raw data and get actionable insights from it.
This book is your one-stop guide to mastering Qlik Sense, catering to all your organizational BI needs. You’ll see how you can seamlessly navigate through tons of data from multiple sources and take advantage of the various APIs available in Qlik and its components for guided analytics. You’ll also learn how to embed visualizations into your existing BI solutions and extend the capabilities of Qlik Sense to create new visualizations and dashboards that work across all platforms. We also cover other advanced concepts such as porting your Qlik View applications to Qlik Sense,and working with Qlik Cloud. Finally, you’ll implement enterprise-wide security and access control for resources and data sources through practical examples.
With the knowledge gained from this book, you’ll have become the go-to expert in your organization when it comes to designing BI solutions using Qlik Sense.
What you will learn
- Understand the importance of self-service analytics and the IKEA-effect.
- Explore all the available data modeling techniques and create efficient and optimized data models.
- Master security rules and translate permission requirements into security rule logic.
- Familiarize yourself with different types of Master Key Item(MKI) and know how and when to use MKI.
- Script and write sophisticated ETL code within Qlik Sense to facilitate all data modeling and data loading techniques.
- Get an extensive overview of which APIs are available in Qlik Sense and how to take advantage of a technology with an API.
- Develop basic mashup HTML pages and deploy successful mashup projects.
Who This Book Is For
This book is for Business Intelligence professionals and Data Analysts who want to become experts in using Qlik Sense. If you have extensively used QlikView in the past and are looking to transition to Qlik Sense, this book will also help you. A fundamental understanding of how Qlik Sense works and its features is all you need to get started with this book.
Table of Contents
- Qlik Sense Self Service Model
- Transitioning from QlikView to Qlik Sense
- Security Rules: Attribute Based Access Control
- Master Key Items in Qlik Sense
- Qlik Sense on the Cloud
- Qlik Sense Data Modelling
- Best Practices for Loading Data in Qlik Sense
- Advanced Scripting in Qlik Sense
- Advanced Expressions in Qlik Sense
- Qlik Sense API Overview
- Working with the Qlik Dev Hub
- Coding in Qlik Sense
- Creating Extensions in QlikSense
- Integrating Qlik Sense in Web Sites via Mashups
Hands-On Business Intelligence with Qlik Sense: Implement self-service data analytics with insights and guidance from Qlik Sense experts

Create dynamic dashboards to bring interactive data visualization to your enterprise using Qlik Sense
Key Features
- Implement various Qlik Sense features to create interactive dashboards.
- Analyze data easily and make business decisions faster using Qlik Sense.
- Perform self-service data analytics and geospatial analytics using an example-based approach.
Book Description
Qlik Sense allows you to explore simple-to-complex data to reveal hidden insights and data relationships to make business-driven decisions.
Hands-On Business Intelligence with Qlik Sense begins by helping you get to grips with underlying Qlik concepts and gives you an overview of all Qlik Sense’s features. You will learn advanced modeling techniques and learn how to analyze the data loaded using a variety of visualization objects. You’ll also be trained on how to share apps through Qlik Sense Enterprise and Qlik Sense Cloud and how to perform aggregation with AGGR. As you progress through the chapters, you’ll explore the stories feature to create data-driven presentations and update an existing story. This book will guide you through the GeoAnalytics feature with the geo-mapping object and GeoAnalytics connector. Furthermore, you’ll learn about the self-service analytics features and perform data forecasting using advanced analytics. Lastly, you’ll deploy Qlik Sense apps for mobile and tablet.
By the end of this book, you will be well-equipped to run successful business intelligence applications using Qlik Sense’s functionality, data modeling techniques, and visualization best practices.
What you will learn
- Discover how to load, reshape, and model data for analysis.
- Apply data visualization practices to create stunning dashboards.
- Make use of Python and R for advanced analytics.
- Perform geo-analysis to create visualizations using native objects.
- Learn how to work with AGGR and data stories.
Who this book is for
If you’re a data analyst, BI developer, or interested in business intelligence and want to gain practical experience of working on Qlik Sense, this book is for you. You’ll also find it useful if you want to explore Qlik Sense’s next-generation applications for self-service business intelligence. No prior experience of working with Qlik Sense is required.
Table of Contents
- Getting started with Qlik Sense
- Loading Data in Qlik Sense
- Implementing Data Modeling Techniques
- Working with Application Structure
- Creating a Sales Analysis App using Qlik Sense
- Interacting with Advanced Expressions
- Creating Data Stories
- Engaging ODAG
- Creating a Native Map Using Geo Analytics
- Working with Self Service Analytics
- Data Forecasting Using Advanced Analytics
- Deploying Qlik Sense Apps for Mobile/Tablets
Qlik Sense Cookbook: Over 80 recipes on data analytics to solve business intelligence challenges, 2nd Edition, Kindle Edition
Create dynamic dashboards to perform interactive analytics for business intelligence operations
Key Features
- Explore newly added features in Qlik Sense.
- Discover best practices to work with data using Qlik Sense.
- Learn to implement advanced functions for better data insight.
Book Description
Qlik Sense allows you to explore simple and complex data to reveal hidden insight and data relationships that help you make quality decisions for overall productivity. An expert Qlik Sense user can use its features for business intelligence in an enterprise environment effectively. Qlik Sense Cookbook is an excellent guide for all aspiring Qlik Sense developers and will empower you to create featured desktop applications to obtain daily insights at work.
This book takes you through the basics and advanced functions of Qlik Sense February 2018 release. You’ll start with a quick refresher on obtaining data from data files and databases, and move on to some more refined features including visualization, and scripting, as well as managing apps and user interfaces. You will then understand how to work with advanced functions like set analysis and set expressions. As you make your way through this book, you will uncover newly added features in Qlik Sense such as new visualizations, label expressions and colors for dimension and measures.
By the end of this book, you will have explored various visualization extensions to create your own interactive dashboard with the required tips and tricks. This will help you overcome challenging situations while developing your applications in Qlik Sense.
What you will learn
- Source, preview, and distribute your data through interactive dashboards.
- Explore and work with the latest visualization functions.
- Learn how to write and use script subroutines.
- Make your UI advanced and intuitive with custom objects and indicators.
- Use visualization extensions for your Qlik Sense dashboard.
- Work with Aggr and learn to use it within set analysis.
Who this book is for
Qlik Sense Cookbook is for data and BI analysts who want to become well versed with Qlik Sense to apply business intelligence in data. If you are a beginner in data analytics and want to adopt an independent recipe-based approach to learn the required concepts and services in detail, this book is ideal! Individuals with prior knowledge of its sister product, QlikView, will also benefit from this book. Familiarity with the basics of business intelligence is a prerequisite.
Table of Contents
- Getting Started with the Data
- Visualizations
- Scripting
- Managing Apps and User Interface
- Useful Functions
- Set Analysis
- Using Extensions in Qlik Sense®
- Advanced Aggregation with AGGR
- Tips and Tricks
Qlik Sense: Advanced Data Visualization for Your Organization: Create smart data visualizations and predictive analytics solutions, 1st Edition, Kindle Edition
Perform Interactive Data Analysis with Smarter Visualizations and Support your Enterprise-wide Analytical Needs
Key Features
- Get a practical demonstration of discovering data for sales, human resources, and more using Qlik Sense.
- Create dynamic dashboards for business intelligence and predictive analytics.
- Create and collaborate comprehensive analytical solutions using Rattle and Qlik Sense.
Book Description
Qlik Sense is powerful and creative visual analytics software that allows users to discover data, explore it, and dig out meaningful insights in order to make a profit and make decisions for your business. This course begins by introducing you to the features and functions of the most modern edition of Qlik Sense so you get to grips with the application.
The course will teach you how to administer the data architecture in Qlik Sense, enabling you to customize your own Qlik Sense application for your business intelligence needs. It also contains numerous recipes to help you overcome challenging situations while creating fully featured desktop applications in Qlik Sense. It explains how to combine Rattle and Qlik Sense Desktop to apply predictive analytics to your data to develop real-world interactive data applications. The course includes premium content from three of our most popular books:
- Learning Qlik Sense: The Official Guide Second Edition
- Qlik Sense Cookbook
- Predictive Analytics using Rattle and Qlik Sense
On completion of this course, you will be self-sufficient in improving your data analysis and will know how to apply predictive analytics to your datasets. Through this course, you will be able to create predictive models and data applications, allowing you to explore your data insights much deeper.
What you will learn
- Build simple visualization models with Rattle and Qlik Sense Desktop.
- Get to grips with the life cycle and new visualization functions of a Qlik Sense application.
- Discover simple ways to examine data and get it ready for analysis.
- Visualize your data with Qlik Sense’s engaging and informative graphs.
- Build efficient and responsive Associative Models.
- Optimize Qlik Sense for sales, human resources, and demographic data discovery.
- Explore various tips and tricks of navigation for the Qlik Sense® front end.
- Develop creative extensions for your Qlik Sense® dashboard.
Table of Contents
- Qlik Sense® and Data Discovery
- Overview of a Qlik Sense® Application’s Life Cycle
- Empowering Next Generation Data Discovery Consumers
- Contributing to Data Discovery
- Authoring Engaging Applications
- Building Qlik Sense® Data Models
- Qlik Sense® Apps in the Cloud
- Extending the Qlik® Analytic Platform
- Administering Qlik Sense®
- Sales Discovery
- Human Resource Discovery
- Travel Expense Discovery
- Demographic Data Discovery
- Getting Started with the Data
- Visualizations
- Scripting
- Managing Apps and User Interface
- Useful Functions
- Set Analysis
- Extensions in Qlik Sense®
What’s New in Version 2.1.1?
- Appendix
- Getting Ready with Predictive Analytics
- Preparing Your Data
- Exploring and Understanding Your Data
- Creating Your First Qlik Sense Application
- Clustering and Other Unsupervised Learning Methods
- Decision Trees and Other Supervised Learning Methods
- Model Evaluation
- Visualizations, Data Applications, Dashboards, and Data Storytelling
- Developing a Complete Application
- Bibliography
Hands-On Business Intelligence with Qlik Sense: Implement self-service data analytics with insights and guidance from Qlik Sense experts
Create dynamic dashboards to bring interactive data visualization to your enterprise using Qlik Sense
Key Features
- Implement various Qlik Sense features to create interactive dashboards
- Analyze data easily and make business decisions faster using Qlik Sense
- Perform self-service data analytics and geospatial analytics using an example-based approach
Book Description
Qlik Sense allows you to explore simple-to-complex data to reveal hidden insights and data relationships to make business-driven decisions.
Hands-On Business Intelligence with Qlik Sense begins by helping you get to grips with underlying Qlik concepts and gives you an overview of all Qlik Sense's features. You will learn advanced modeling techniques and learn how to analyze the data loaded using a variety of visualization objects. You'll also be trained on how to share apps through Qlik Sense Enterprise and Qlik Sense Cloud and how to perform aggregation with AGGR. As you progress through the chapters, you'll explore the stories feature to create data-driven presentations and update an existing story. This book will guide you through the GeoAnalytics feature with the geo-mapping object and GeoAnalytics connector. Furthermore, you'll learn about the self-service analytics features and perform data forecasting using advanced analytics. Lastly, you'll deploy Qlik Sense apps for mobile and tablet.
By the end of this book, you will be well-equipped to run successful business intelligence applications using Qlik Sense's functionality, data modeling techniques, and visualization best practices.
What you will learn
- Discover how to load, reshape, and model data for analysis
- Apply data visualization practices to create stunning dashboards
- Make use of Python and R for advanced analytics
- Perform geo-analysis to create visualizations using native objects
- Learn how to work with AGGR and data stories
Who this book is for
If you're a data analyst, BI developer, or interested in business intelligence and want to gain practical experience of working on Qlik Sense, this book is for you. You'll also find it useful if you want to explore Qlik Sense's next-generation applications for self-service business intelligence. No prior experience of working with Qlik Sense is required.
Table of Contents
- Getting started with Qlik Sense
- Loading Data in Qlik Sense
- Implementing Data Modeling Techniques
- Working with Application Structure
- Creating a Sales Analysis App using Qlik Sense
- Interacting with Advanced Expressions
- Creating Data Stories
- Engaging ODAG
- Creating a Native Map Using Geo Analytics
- Working with Self Service Analytics
- Data Forecasting Using Advanced Analytics
- Deploying Qlik Sense Apps for Mobile/Tablets
Qlik Sense Materials
Qlik Sense Training
Qlik Sense Licensing
Additional Modules of Qlik Sense
Qlik Sense Security
Qlik Sense SaaS
Qlik Data Integration
Qlik Sense Mobile
GeoAnalytics in Qlik Sense
Embedded Analytics
Data Sources in Qlik Sense
Vizlib
NPrinting
Tableau
Tableau Your Data!: Fast and Easy Visual Analysis with Tableau Software
2nd Edition
2nd Edition
Tableau is designed specifically to provide fast and easy visual analytics. The intuitive drag-and-drop interface helps you create interactive reports, dashboards, and visualizations, all without any special or advanced training. This all new edition of Tableau Your Data! is your Tableau companion, helping you get the most out of this invaluable business toolset.Tableau Your Data! shows you how to build dynamic, best of breed visualizations using the Tableau Software toolset. This comprehensive guide covers the core feature set for data analytics, and provides clear step-by-step guidance toward best practices and advanced techniques that go way beyond the user manual. You'll learn how Tableau is different from traditional business information analysis tools, and how to navigate your way around the Tableau 9.0 desktop before delving into functions and calculations, as well as sharing with the Tableau Server. Analyze data more effectively with Tableau Desktop
- Customize Tableau's settings for your organization's needs with detailed real-world examples on data security, scaling, syntax, and more
- Deploy visualizations to consumers throughout the enterprise – from sales to marketing, operations to finance, and beyond
- Understand Tableau functions and calculations and leverage Tableau across every link in the value chain
- Learn from actual working models of the book's visualizations and other web-based resources via a companion website
Tableau helps you unlock the stories within the numbers, and Tableau Your Data! puts the software's full functionality right at your fingertips.
Getting Started with Tableau 2019.2: Effective data visualization and business intelligence with the new features of Tableau 2019.2, 2nd Edition
Key Features
- Get up and running with the newly released features of Tableau 2019.2
- Create enterprise-grade dashboard and reports to communicate your insights effectively
- Begin your Tableau journey by understanding its core functionalities
Book Description Tableau is one of the leading data visualization tools and is regularly updated with new functionalities and features. The latest release, Tableau 2019.2, promises new and advanced features related to visual analytics, reporting, dashboarding, and a host of other data visualization aspects. Getting Started with Tableau 2019.2 will get you up to speed with these additional functionalities.
The book starts by highlighting the new functionalities of Tableau 2019.2, providing concrete examples of how to use them. However, if you're new to Tableau, don't worry – you'll be guided through the major aspects of Tableau with relevant examples. You'll learn how to connect to data, build a data source, visualize your data, build a dashboard, and even share data online. In the concluding chapters, you'll delve into advanced techniques such as creating a cross-database join and data blending.
By the end of this book, you will be able to use Tableau effectively to create quick, cost-effective, and business-efficient Business Intelligence (BI) solutions.
What you will learn
- Discover new functionalities such as 'Ask Data', the new way to interact with your data using natural language
- Connect tables and make transformations such as pivoting the field and splitting columns
- Build an efficient data source for analysis
- Design insightful data visualization using different mark types and properties
- Develop powerful dashboards and stories
- Share your work and interact with Tableau Server
- Use Tableau to explore your data and find new insights
- Explore Tableau's advanced features and gear up for upcoming challenges
Who this book is for Existing Tableau users and BI professionals who want to get up to speed with what's new in Tableau 2019 will find this beginner-level book to be a very useful resource. Some experience of Tableau is assumed, however, the book also features introductory concepts, which even beginners can take advantage of.
Table of Contents
- Catching Up with Tableau 2019
- The Tableau Core
- A First Dashboard and Exploration
- Connecting to Data and Simple Transformations
- Building an Efficient Data Source
- Design Insightful Visualizations
- Powerful Dashboards, Stories, and Actions
- Publishing and Interacting in Tableau Server
- An Introduction to Calculations
- Analytics and Parameters
- Advanced Data Connections
- Dealing with Security
- How to Keep Growing Your Skills
Learning Tableau 2020: Create effective data visualizations, build interactive visual analytics, and transform your organization, 4th Edition
Kindle Edition
Kindle Edition
Publisher's note: This edition from 2020 is outdated and does not make use of the most recent Tableau features. A new fifth edition, updated for Tableau 2022, is now available.
Key Features
- Explore the latest Tableau 2020 features and redefine business analytics for your firm
- Understand visualizing data and creating interactive dashboards to gain meaningful insights
- Learn implementing effective data storytelling to redefine how your business leverages data and makes decisions
Book Description
Learning Tableau strengthens your command on Tableau fundamentals and builds on advanced topics.
The book starts by taking you through foundational principles of Tableau. We then demonstrate various types of connections and how to work with metadata. We teach you to use a wide variety of visualizations to analyze and communicate the data, and introduce you to calculations and parameters. We then take an in-depth look at level of detail (LOD) expressions and use them to solve complex data challenges. Up next, we show table calculations, how to extend and alter default visualizations, build an interactive dashboard, and master the art of telling stories with data.
This Tableau book will introduce you to visual statistical analytics capabilities, create different types of visualizations and dynamic dashboards for rich user experiences. We then move on to maps and geospatial visualization, and the new Data Model capabilities introduced in Tableau 2020.2. You will further use Tableau Prep’s ability to clean and structure data and share the stories contained in your data.
By the end of this book, you will be proficient in implementing the powerful features of Tableau 2020 for decision-making.
What you will learn
- Develop stunning visualizations to explain complex data with clarity
- Explore exciting new Data Model capabilities
- Connect to various data sources to bring all your data together
- Leverage Tableau Prep Builder’s amazing capabilities for data cleaning and structuring
- Create and use calculations to solve problems and enrich the analytics
- Master advanced topics such as sets, LOD calculations, and much more
- Enable smart decisions with data clustering, distribution, and forecasting
- Share your data stories to build a culture of trust and action
Who this book is for
This Tableau book is for anyone who wants to understand data. If you're new to Tableau, don't worry. This book will simplify Tableau for beginners to build on the foundations to help you understand how Tableau really works and then builds on that knowledge with practical examples before moving on to advanced techniques.
Having a bit of background with data will help, but you don't need to know scripting, SQL or database structures.
Table of Contents
- Taking Off with Tableau
- Connecting to Data in Tableau
- Moving Beyond Basic Visualizations
- Starting an Adventure with Calculations and Parameters
- Leveraging Level of Detail Calculations
- Diving Deep with Table Calculations
- Making Visualizations That Look Great and Work Well
- Telling a Data Story with Dashboards
- Visual Analytics – Trends, Clustering, Distributions, and Forecasting
- Advanced Visualizations
- Dynamic Dashboards
- Exploring Mapping and Advanced Geospatial Features
- Understanding the Tableau Data Model, Joins, and Blends
- Structuring Messy Data to Work Well in Tableau
- Taming Data with Tableau Prep
- Sharing Your Data Story
Tableau 2019.x Cookbook: Over 115 recipes to build end-to-end analytical solutions using Tableau
1st Edition, Kindle Edition
1st Edition, Kindle Edition
Perform advanced dashboard, visualization, and analytical techniques with Tableau Desktop, Tableau Prep, and Tableau Server
Key Features
- Unique problem-solution approach to aid effective business decision-making
- Create interactive dashboards and implement powerful business intelligence solutions
- Includes best practices on using Tableau with modern cloud analytics services
Book Description
Tableau has been one of the most popular business intelligence solutions in recent times, thanks to its powerful and interactive data visualization capabilities. Tableau 2019.x Cookbook is full of useful recipes from industry experts, who will help you master Tableau skills and learn each aspect of Tableau's ecosystem.
This book is enriched with features such as Tableau extracts, Tableau advanced calculations, geospatial analysis, and building dashboards. It will guide you with exciting data manipulation, storytelling, advanced filtering, expert visualization, and forecasting techniques using real-world examples. From basic functionalities of Tableau to complex deployment on Linux, you will cover it all. Moreover, you will learn advanced features of Tableau using R, Python, and various APIs. You will learn how to prepare data for analysis using the latest Tableau Prep. In the concluding chapters, you will learn how Tableau fits the modern world of analytics and works with modern data platforms such as Snowflake and Redshift. In addition, you will learn about the best practices of integrating Tableau with ETL using Matillion ETL.
By the end of the book, you will be ready to tackle business intelligence challenges using Tableau's features.
What you will learn
- Understand the basic and advanced skills of Tableau Desktop
- Implement best practices of visualization, dashboard, and storytelling
- Learn advanced analytics with the use of build in statistics
- Deploy the multi-node server on Linux and Windows
- Use Tableau with big data sources such as Hadoop, Athena, and Spectrum
- Cover Tableau built-in functions for forecasting using R packages
- Combine, shape, and clean data for analysis using Tableau Prep
- Extend Tableau’s functionalities with REST API and R/Python
Who this book is for
Tableau 2019.x Cookbook is for data analysts, data engineers, BI developers, and users who are looking for quick solutions to common and not-so-common problems faced while using Tableau products. Put each recipe into practice by bringing the latest offerings of Tableau 2019.x to solve real-world analytics and business intelligence challenges. Some understanding of BI concepts and Tableau is required.
Table of Contents
- Getting Started with Tableau Software
- Data Manipulation
- Tableau Extracts
- Tableau Desktop Advanced Calculations
- Tableau Desktop Advanced Filtering
- Building Dashboard
- Telling story with Tableau
- Tableau Visualization
- Tableau Advanced Visualization
- Tableau for Big Data
- Forecasting with Tableau
- Advanced Analytics with Tableau
- Deploy Tableau Server
- Tableau Troubleshooting
- Preparing Data for Analysis with Tableau Prep
- ETL Best Practices for Tableau
Tableau Desktop Certified Associate: Exam Guide: Develop your Tableau skills and prepare for Tableau certification with tips from industry experts
1st Edition, Kindle Edition
1st Edition, Kindle Edition
Learn through hands-on exercises covering a variety of topics including data connections, analytics, and dashboards to effectively prepare for the Tableau Desktop Certified Associate exam
Key Features
- Prepare for the Tableau Desktop Certified Associate exam with the help of tips and techniques shared by experts
- Implement Tableau’s advanced analytical capabilities such as forecasting
- Delve into advanced Tableau features and explore best practices for building dashboards
Book Description
The Tableau Desktop Certified Associate exam measures your knowledge of Tableau Desktop and your ability to work with data and data visualization techniques. This book will help you to become well-versed in Tableau software and use its business intelligence (BI) features to solve BI and analytics challenges.
With the help of this book, you'll explore the authors' success stories and their experience with Tableau. You'll start by understanding the importance of Tableau certification and the different certification exams, along with covering the exam format, Tableau basics, and best practices for preparing data for analysis and visualization. The book builds on your knowledge of advanced Tableau topics such as table calculations for solving problems. You'll learn to effectively visualize geographic data using vector maps. Later, you'll discover the analytics capabilities of Tableau by learning how to use features such as forecasting. Finally, you'll understand how to build and customize dashboards, while ensuring they convey information effectively. Every chapter has examples and tests to reinforce your learning, along with mock tests in the last section.
By the end of this book, you'll be able to efficiently prepare for the certification exam with the help of mock tests, detailed explanations, and expert advice from the authors.
What you will learn
- Apply Tableau best practices to analyze and visualize data
- Use Tableau to visualize geographic data using vector maps
- Create charts to gain productive insights into data and make quality-driven decisions
- Implement advanced analytics techniques to identify and forecast key values
- Prepare customized table calculations to compute specific values
- Answer questions based on the Tableau Desktop Certified Associate exam with the help of mock tests
Who this book is for
This Tableau certification book is for business analysts, BI professionals, and data analysts who want to become certified Tableau Desktop Associates and solve a range of data science and business intelligence problems using this example-packed guide. Some experience in Tableau Desktop is expected to get the most out of this book.
Table of Contents
- Building Your Data Model
- Working with Worksheets
- Analyzing Data Using Charts
- Visualizing Geographic Data
- Understanding Simple Calculations in Tableau
- Tableau Table Calculations
- Level of Detail Expressions
- Leveraging Analytics Capabilities
- Building Your Dashboards
Communicating Data with Tableau: Designing, Developing, and Delivering Data Visualizations
1st Edition
1st Edition
Go beyond spreadsheets and tables and design a data presentation that really makes an impact.
This practical guide shows you how to use Tableau Software to convert raw data into compelling data visualizations that provide insight or allow viewers to explore the data for themselves.
Ideal for analysts, engineers, marketers, journalists, and researchers, this book describes the principles of communicating data and takes you on an in-depth tour of common visualization methods. You’ll learn how to craft articulate and creative data visualizations with Tableau Desktop 8.1 and Tableau Public 8.1.
- Present comparisons of how much and how many
- Use blended data sources to create ratios and rates
- Create charts to depict proportions and percentages
- Visualize measures of mean, median, and mode
- Lean how to deal with variation and uncertainty
- Communicate multiple quantities in the same view
- Show how quantities and events change over time
- Use maps to communicate positional data
- Build dashboards to combine several visualizations
Tableau Data Visualization Cookbook(Chinese Edition)
Paperback – August 1, 2014
Paperback – August 1, 2014
Pub Date: 2014-08-01 Pages: 156 Language: Chinese Publisher: Machinery Industry Press if you have had this experience: In the last minute of the project suddenly being asked to modify or add a data point in the figure this time in order to complete project. you will have to reduce the risk of risking accuracy. however. this does not happen in Tableau. Tableau is a revolutionary tool kit. which allows you to simply and efficiently create high-quality data visualization graphics. This book by a large number of specific cases. explain in detail how to use Tableau software for data visualization analysis. including basic use. specific steps to achieve some practical principles and techniques for the rapid grasp Tableau Software provides detailed guidance. Data Analysis Technical Series: Tableau data visualization combat 9 chapters. the first chapter explains how to connect diffe.
Pro Tableau: A Step-by-Step Guide
1st ed. Edition, Kindle Edition
1st ed. Edition, Kindle Edition
Leverage the power of visualization in business intelligence and data science to make quicker and better decisions
Use statistics and data mining to make compelling and interactive dashboards. This book will help those familiar with Tableau software chart their journey to being a visualization expert.
Pro Tableau demonstrates the power of visual analytics and teaches you how to:
- Connect to various data sources such as spreadsheets, text files, relational databases (Microsoft SQL Server, MySQL, etc.), non-relational databases (NoSQL such as MongoDB, Cassandra), R data files, etc.
- Write your own custom SQL, etc.
- Perform statistical analysis in Tableau using R
- Use a multitude of charts (pie, bar, stacked bar, line, scatter plots, dual axis, histograms, heat maps, tree maps, highlight tables, box and whisker, etc.)
What you’ll learn
- Connect to various data sources such as relational databases (Microsoft SQL Server, MySQL), non-relational databases (NoSQL such as MongoDB, Cassandra), write your own custom SQL, join and blend data sources, etc.
- Leverage table calculations (moving average, year over year growth, LOD (Level of Detail), etc.
- Integrate Tableau with R
- Tell a compelling story with data by creating highly interactive dashboards
Who this book is for
All levels of IT professionals, from executives responsible for determining IT strategies to systems administrators, to data analysts, to decision makers responsible for driving strategic initiatives, etc. The book will help those familiar with Tableau software chart their journey to a visualization expert.
Creating Data Stories with Tableau Public
Kindle Edition
Kindle Edition
About This Book
- Learn the basics of creating visualizations with Tableau using this concise reference book
- Understand how to join and aggregate your data sources using Tableau
- It is a step by step guide that uses examples to help you understand the key concepts and feature of Tableau Public
Who This Book Is For
This book is targeted at investigative journalists and bloggers with an interest in making rich and interactive data visualizations. Intermediate Tableau Public users and organizations can also use this book as a reference guide and teaching aid. Members of the media team, such as data specialists, web developers, editors, producers, and managers can also benefit from an understanding of the structure and challenges of writing an interactive and interesting data visualization using Tableau Public.
What You Will Learn
- Connect to various data sources and understand what data is appropriate for Tableau Public
- Understand chart types and when to use specific chart types with different types of data
- Join and aggregate data for use in Tableau Public data stories
- Discover features of Tableau Public, from basic to advanced
- Involve calculations in Tableau Public
- Build geographic maps to bring context to data
- Create dashboards from one or more separate data visualizations
- Create filters and actions to allow greater interactivity to Tableau Public visualizations and dashboards
- Publish and embed Tableau visualizations and dashboards in articles
In Detail
Tableau Public is a very useful tool in anyone's data reporting toolbox that allows authors to add an interactive data element to any article. It allows investigative journalists and bloggers to tell a “data story”, allowing others to explore your data visualization. The relative ease of Tableau Public visualization creation allows data stories to be developed rapidly. It allows readers to explore data associations in multiple-sourced public data, and uses state-of-the-art dashboard and chart graphics to immerse the users in an interactive experience.
This book offers investigative journalists, bloggers, and other data story tellers a rich discussion of visualization creation topics, features, and functions. This book allows data story tellers to quickly gain confidence in understanding and expanding their visualization-creation knowledge, and allows them to quickly create interesting, interactive data visualizations to bring a richness and vibrancy to complex articles.
The book takes you from basic concepts in visualization creation, like connecting to data sources, cleansing data, chart types, common functions, map creation, and publishing to the Web, to more advanced functions.
It is a great overview and reference guide for beginner to intermediate Tableau Public data story tellers, and covers creation of Tableau Public visualizations of varying complexities.
Style and approach
This book is a crisp, systematic, and tutorial-styled guide to building interactive Tableau visualizations.
Jumpstart Tableau: A Step-By-Step Guide to Better Data Visualization
1st ed. Edition, Kindle Edition
1st ed. Edition, Kindle Edition
Learn how to create powerful data visualizations easily and quickly. You will develop reports and queries, and perform data analysis.
Jumpstart Tableau covers the basic reporting and analysis functions that most BI users perform in their day-to-day work. These include connecting to a data source, working with dimensions and measures, developing reports and charts, saving workbooks, filtering, swapping, sorting, formatting, grouping, creating hierarchies, forecasting, exporting, distributing, as well developing various chart types.
Each exercise in Jumpstart Tableau provides screenshots that cover every step from start to finish. The exercises are based on a comprehensive sample Excel-based data source that Tableau Software (version 9) has provided, which makes it very easy to duplicate the exercises on the real software.
This book teaches you to:
- Execute each function in a step-by-step manner
- Work up to more advanced and complex Tableau functionality
- Integrate individual development of content, such as tables/charts and visualizations., onto a dashboard for an effective presentation
What You'll Learn
- Connect to data sources
- Develop reports
- Create visualizations
- Perform analysis functions (e.g., filtering, drilldown, sorting, grouping, forecasting, etc.)
- Save visualizations in different formats and distribute them
- Develop dashboards and their content
Who This Book Is For
Novice Tableau users, BI end users, as well as developers and business analysts. Also, students in university courses on dashboards and data visualization as well as BI and data analysis can quickly get up to speed with Tableau tools and use them for implementing the hands-on projects associated with these courses."
Mastering Tableau 2021: Implement advanced business intelligence techniques and analytics with Tableau, 3rd Edition
Build, design, and improve advanced business intelligence solutions using Tableau’s latest features, including Tableau Prep Builder, Tableau Hyper, and Tableau Server
Key Features
- Master new features in Tableau 2021 to solve real-world analytics challenges
- Perform geo-spatial, time series, and self-service analytics using real-life examples
- Build and publish dashboards and explore storytelling using Python and R integration support
Book Description
Tableau is one of the leading business intelligence (BI) tools that can help you solve data analysis challenges. With this book, you will master Tableau's features and offerings in various paradigms of the BI domain.
Updated with fresh topics including Quick Level of Detail expressions, the newest Tableau Server features, Einstein Discovery, and more, this book covers essential Tableau concepts and advanced functionalities. Leveraging Tableau Hyper files and using Prep Builder, you'll be able to perform data preparation and handling easily. You'll gear up to perform complex joins, spatial joins, unions, and data blending tasks using practical examples. Next, you'll learn how to execute data densification and further explore expert-level examples to help you with calculations, mapping, and visual design using Tableau extensions. You'll also learn about improving dashboard performance, connecting to Tableau Server and understanding data visualization with examples. Finally, you'll cover advanced use cases such as self-service analysis, time series analysis, and geo-spatial analysis, and connect Tableau to Python and R to implement programming functionalities within it.
By the end of this Tableau book, you'll have mastered the advanced offerings of Tableau 2021 and be able to tackle common and advanced challenges in the BI domain.
What you will learn
- Get up to speed with various Tableau components
- Master data preparation techniques using Tableau Prep Builder
- Discover how to use Tableau to create a PowerPoint-like presentation
- Understand different Tableau visualization techniques and dashboard designs
- Interact with the Tableau server to understand its architecture and functionalities
- Study advanced visualizations and dashboard creation techniques
- Brush up on powerful self-service analytics, time series analytics, and geo-spatial analytics
Who this book is for
This book is designed for business analysts, business intelligence professionals and data analysts who want to master Tableau to solve a range of data science and business intelligence problems. The book is ideal if you have a good understanding of Tableau and want to take your skills to the next level.
Table of Contents
- Getting Up to Speed – A Review of the Basics
- All About Data – Getting Your Data Ready
- Tableau Prep Builder
- All About Data – Joins, Blends, and Data Structures
- Table Calculations
- All About Data – Data Densification, Cubes, and Big Data
- Level of Detail Calculations
- Beyond the Basic Chart Types
- Mapping
- Tableau for Presentations
- Visualization Best Practices and Dashboard Design
- Advanced Analytics
- Improving Performance
- Interacting with Tableau Server/Online
- Programming Tool Integration
Tableau Dashboard Cookbook
Paperback – January 11, 2016
Paperback – January 11, 2016
Practical Tableau: 100 Tips, Tutorials, and Strategies from a Tableau Zen Master
1st Edition
1st Edition

Whether you have some experience with Tableau software or are just getting started, this manual goes beyond the basics to help you build compelling, interactive data visualization applications.
Author Ryan Sleeper, one of the world`s most qualified Tableau consultants, complements his web posts and instructional videos with this guide to give you a firm understanding of how to use Tableau to find valuable insights in data.Over five sections, Sleeperâ??recognized as a Tableau Zen Master, Tableau Public Visualization of the Year author, and Tableau Iron Viz Championâ??provides visualization tips, tutorials, and strategies to help you avoid the pitfalls and take your Tableau knowledge to the next level.
Practical Tableau sections include:
- Fundamentals: get started with Tableau from the beginning
- Chart types: use step-by-step tutorials to build a variety of charts in Tableau
- Tips and tricks: learn innovative uses of parameters, color theory, how to make your Tableau workbooks run efficiently, and more
- Framework: explore the INSIGHT framework, a proprietary process for building Tableau dashboards
- Storytelling: learn tangible tactics for storytelling with data, including specific and actionable tips you can implement immediately
Metadata (The MIT Press Essential Knowledge series)
Everything we need to know about metadata, the usually invisible infrastructure for information with which we interact every day.
When “metadata” became breaking news, appearing in stories about surveillance by the National Security Agency, many members of the public encountered this once-obscure term from information science for the first time. Should people be reassured that the NSA was “only” collecting metadata about phone calls—information about the caller, the recipient, the time, the duration, the location—and not recordings of the conversations themselves? Or does phone call metadata reveal more than it seems? In this book, Jeffrey Pomerantz offers an accessible and concise introduction to metadata.
In the era of ubiquitous computing, metadata has become infrastructural, like the electrical grid or the highway system. We interact with it or generate it every day. It is not, Pomerantz tell us, just “data about data.” It is a means by which the complexity of an object is represented in a simpler form. For example, the title, the author, and the cover art are metadata about a book. When metadata does its job well, it fades into the background; everyone (except perhaps the NSA) takes it for granted.
Pomerantz explains what metadata is, and why it exists. He distinguishes among different types of metadata—descriptive, administrative, structural, preservation, and use—and examines different users and uses of each type. He discusses the technologies that make modern metadata possible, and he speculates about metadata's future. By the end of the book, readers will see metadata everywhere. Because, Pomerantz warns us, it's metadata's world, and we are just living in it.
Rapid Graphs with Tableau Software: Create Intuitive, Actionable Insights in Just 15 Days (Tableau 5)
Paperback – July 8, 2009
Paperback – July 8, 2009
Please visit freakalytics.com/rgb for the Table of Contents and Chapter 1.
Tired of boring spreadsheets and data overload from confusing graphs? Master the art of rapid graphs with Tableau Software. Tableau is designed with one goal in mind – to give you the power to quickly explore and understand your data so that you can use your results in a wide variety of real-world situations. After learning Tableau, you will be able to clearly communicate your findings with audience-friendly graphs and tables.
A picture is worth a thousand words"" is a common saying that is more relevant today than ever as volumes of data multiply and the need for easy access to answers becomes more critical. From simple yet stunning graphs to vibrant multi-graph views capable of communicating incredible insights, this book will cover the extensive range of Tableau capabilities in easy-to-follow examples.
Stephen leads both public and custom on-site Tableau training sessions throughout the year. Please visit freakalytics.com/training for more details.
Tableau Desktop Specialist Practice Tests 2020: Prepare for and pass the current Tableau Desktop Specialist Exam (Tableau Certification Exams)
Included in this ebook:
- Four Practice Tests (30 questions each with an exact Tableau domains' breakdown): Tableau multiple-choice/multi-response format (22 theoretical, 8 hands-on).
- Answer Key: why this, not that + clickable links to supporting materials (docs, blogs, wikis, and videos)
- Free online resources: books, video, blogs, podcasts
The course has been updated with June 2020 Tableau Exam Questions Content.
All referenced data sources are available on GitHub at EmilFrlez/tableau-ca
What you will learn:
- Assess your strengths and weaknesses in four Tableau Desktop Specialist Exam knowledge areas
- Boost your chances of passing real Tableau Desktop Specialist Exam
- Become aware of terms, definitions and equations you have to memorize
- Prepare for Connecting to & Preparing Data, Exploring & Analyzing Data, Sharing Insights, and Understanding Tableau Concepts Exam Domains
- Make sure you are not wasting your Tableau exam fee ($100)
- Prepare for a Business Intelligence or Data Scientist job interview
Requirements
* Desktop computer (Windows or Mac), tablet or smartphone (recommended)
* Tableau Public or Desktop Professional Installation (recommended, free)
* Probability and Statistics Essentials at the college level (recommended)
Target students/Who this course is for:
* Students preparing for the 2020 Tableau Desktop Specialist Exam
Professionals preparing for Job Interviews in Data Analytics and Business Intelligence.
This exam is for those students who have foundational skills and understanding of Tableau Desktop and at least one month of applying this understanding in the product.
Ebook Description:
Please note that provided four practice tests are mock exams, not brain dumps. They are designed to replicate the style, topics, and complexity of the real-world Tableau certification exam. The number of questions for each Domain Topic is chosen to match the current Tableau Desktop Specialist Exam Guide. The sentence length and structure of questions are adjusted to match examples from the Exam Guide. The question subjects (e.g. using the Stocks table, using Flights table, etc), actions (e.g. 'create a crosstab/chart', 'how can you …', etc), and conditions ('which is the most probable', 'which is the best reason', etc), also follow the Tableau Sample Exam Format. A candidate preparing for the exam will expend about the same time and apply about the same mental effort understanding the question as he would in the real test center environment.
P.S. If you are learning Tableau I recommend you first take the Tableau Desktop Specialist Exam. There are two advantages: (i) you get familiarized with the Tableau Exam format and the online exam environment (administered by Loyalist Exam Services, lcsexams.com), and (ii) the exam fee is just $100 and your Tableau Desktop Specialist certification title does not expire.
P.S.S. A final comment about the validity of the answers: each practice exam question is followed by an answer, explanation of the answer, and explanation of why other multiple choices are wrong. The link(s) (between two and four) to the free online resources are provided (Tableau documentation, other documentation, pdf articles, blogs, and videos). Some questions on a real Tableau Exam are not precisely worded. Sometimes two multiple-choice options appear to be an almost equally acceptable answer. You should not get too worked up over that: if you use these practice exams as one of the building blocks of your studies, you should be able to demonstrate your broad Tableau Desktop knowledge in a job interview and you should be able to pass the Tableau Desktop Specialist Exam (70% passing score required).
"
The Big Book of Dashboards: Visualizing Your Data Using Real-World Business Scenarios

The Big Book of Dashboards presents a comprehensive reference for those tasked with building or overseeing the development of business dashboards.
Comprising dozens of examples that address different industries and departments (healthcare, transportation, finance, human resources, marketing, customer service, sports, etc.) and different platforms (print, desktop, tablet, smartphone, and conference room display) The Big Book of Dashboards is the only book that matches great dashboards with real-world business scenarios.
By organizing the book based on these scenarios and offering practical and effective visualization examples, The Big Book of Dashboards will be the trusted resource that you open when you need to build an effective business dashboard.
In addition to the scenarios there's an entire section of the book that is devoted to addressing many practical and psychological factors you will encounter in your work. It's great to have theory and evidenced-based research at your disposal, but what will you do when somebody asks you to make your dashboard 'cooler' by adding packed bubbles and donut charts?
The expert authors have a combined 30-plus years of hands-on experience helping people in hundreds of organizations build effective visualizations. They have fought many 'best practices' battles and having endured bring an uncommon empathy to help you, the reader of this book, survive and thrive in the data visualization world.
A well-designed dashboard can point out risks, opportunities, and more; but common challenges and misconceptions can make your dashboard useless at best, and misleading at worst. The Big Book of Dashboards gives you the tools, guidance, and models you need to produce great dashboards that inform, enlighten, and engage.
Tableau for Online Marketing Practitioners
Kindle Edition
Kindle Edition
They are very good source of knowledge, especially for beginners, about the software itself. However, I've found that dominating only how to manipulate the software is not enough to make effective visualizations for the job of particular field of industry.
That is the reason I wrote this book, ""Tableau for Online Marketing Practitioners"".
The book introduces 22 techniques that are effective for visualizing Online Marketing related data such as;
- Web Analytics data (such as Google Analytics)
- CPC Ads data (such as AdWords)
- SEO tool data (such as Google Search Console)
The author, who works for one of the 15 Google Analytics Certified Partners in Japan, is seasoned web marketing consultant with 12-year experience in the industry.
His carrier and job include:
- GAIQ holder for about 7 years
- Tableau Desktop 9 Qualified Associate
- Top Contributor in Google Analytics Official Help Forum
- Published a book about Google Analytics, probably best selling in 2015
- Published 2 Kindle books about Tableau in Japanese
- Many speaking opportunities in conferences/seminars
=====
Fact of the book
Software version: Tableau Desktop Professional 9.2.4
Pages: 290 pages, size A4 MS Word
Images: 208 images"
Art + Data: A Collection of Tableau Dashboards (paperback)
Paperback – October 17, 2016
Paperback – October 17, 2016
Maybe you're an executive who wants quick insights into your organization. You're busy. We get that. You'll probably only skim this book in 20 minutes. But we hope you're compelled by its intuitive visual analytics and the chance to track progress and increase your company's impact. How about getting a box of these books to hand out to your data analytics teams across the company?
Maybe you're a team lead who relies on data to fulfill your commitments to your organization. Do you need engaging analytics for your technology group? Sales operations? Finance or marketing program? We're betting yes. Then you'll probably settle in and spend a few hours reading this book and relating to the dashboard examples that best match your department. How about getting 10 or more copies for the other people in your team?
Or maybe you're an analytics expert. You geek out on software like Tableau and digging deep into the realm of data visualization. We do too! You'll likely spend days on this book pouring over all the incredible practices and concepts embedded in it. We hope so anyway. Our intent is to highlight best practices for dashboard design and empower you to further explore all those data points we know you're obsessed with. We got your back on this.
No matter who you are, we're sure you'll agree that successful organizations don't just tell data stories–they use excellent design to do so. They find harmony between data and art. We've done just that by creating our 5 Elements of Dashboard Design: Integrity, Flow, Color, Typeface and Charm. With these powerful standards, we consistently help people use data to realize better outcomes.
So be inspired. Partner with us. And take from this collection of 20 custom dashboards what you will. Then don't be shy. Blog about it. Recommend it to friends. Put it on the office coffee table. Whatever you do, know that we are one of you!"
Practical Tableau: 100 Tips, Tutorials, and Strategies from a Tableau Zen Master
1st Edition
1st Edition
Whether you have some experience with Tableau software or are just getting started, this manual goes beyond the basics to help you build compelling, interactive data visualization applications.
Author Ryan Sleeper, one of the worldâ??s most qualified Tableau consultants, complements his web posts and instructional videos with this guide to give you a firm understanding of how to use Tableau to find valuable insights in data.
Over five sections, Sleeperâ??recognized as a Tableau Zen Master, Tableau Public Visualization of the Year author, and Tableau Iron Viz Championâ??provides visualization tips, tutorials, and strategies to help you avoid the pitfalls and take your Tableau knowledge to the next level.
Practical Tableau sections include:
Fundamentals: get started with Tableau from the beginning
Chart types: use step-by-step tutorials to build a variety of charts in Tableau
Tips and tricks: learn innovative uses of parameters, color theory, how to make your Tableau workbooks run efficiently, and more
Framework: explore the INSIGHT framework, a proprietary process for building Tableau dashboards
Storytelling: learn tangible tactics for storytelling with data, including specific and actionable tips you can implement immediately
Innovative Tableau: 100 More Tips, Tutorials, and Strategies
1st Edition
1st Edition
In this follow-up guide to Practical Tableau, author Ryan Sleeper takes you through a collection of unique tips and tutorials for using this popular software. Beginning to advanced Tableau users will learn how to go beyond Show Me to make better charts and learn dozens of tricks to improve both the author and user experience.
Featuring many approaches he developed himself, Ryan shows you how to create charts that empower Tableau users to explore, understand, and derive value from their data. He also shares many of his favorite tricks that enabled him to become a Tableau Zen Master, Tableau Public Visualization of the Year author, and Tableau Global Iron Viz Champion.
Learn what’s new in Tableau since Practical Tableau was released
Examine unique new charts―timelines, custom gauges, and leapfrog charts―plus innovations to traditional charts such as highlight tables, scatter plots, and maps
Get tips that can help make a Tableau developer’s life easier
Understand what developers can do to make users’ lives easier
Tableau Materials
Training and Certification
Technologies and Features
Data Sources
Data Security
QlikView
QlikView 11 for Developers: Effective analytics techniques for modern Business Intelligence
Gain an in-depth understanding of how to build applications for Business Intelligence using QlikView
Key Features
- Learn to build applications for Business Intelligence while following a practical case – HighCloud Airlines. Each chapter develops parts of the application and it evolves throughout the book along with your own QlikView skills.
- Code bundle for each chapter can be accessed on your local machine without having to purchase a QlikView license.
- Hands-on approach allows you to build a QlikView application that integrates real data from several different sources and presents it in dashboards, analyses and reports.
In Detail
Business Intelligence technologies are a must-have in every business to make informed decisions and keep up-to speed with the ever-evolving markets. QlikView's disruptive technology makes it a key player and leader in the industry; with its flexibility and powerful analytics environment, building QlikView apps can be mastered by both business users as well as developers.
This book will help you learn QlikView Development from a basic to a practitioner level using a step-by-step approach in a practical environment, and apply proven best practices on each topic.
Throughout the book, we will build a QlikView app based on real data about Airline Operations that will help 'HighCloud Airlines' make informed business decisions and analysis-guided strategies. HighCloud Airlines executives are evaluating whether entering the US market is a good strategy and, if so, which line of business should they focus their investments on; they need QlikView to make the best decision.
The application will evolve chapter by chapter, along with your skills, going from a simple proof of concept to creating a Data Model, adding a custom style, building a Dashboard and handling and manipulating the source data via script. We will meet the 'HighCloud Airlines' requirement by using many different data visualization objects and time-saving techniques.
The whole application uses real data taken from the Bureau of Transportation's statistics of the US and encompasses both domestic and international airline operations. With three years worth of data, you will help HighCloud Airlines discover where people travel the most, which are the carriers with the greatest market share, what is the average load factor per airline, which aircraft is the most used to perform flights, which are the busiest airports, and a whole universe of new insights.
What you will learn
- Learn the techniques and best practices to transform data in QlikView via script
- Load data from disparate sources to build an associative Data Model
- Build robust data models and overcoming common modeling challenges
- Design data visualization objects to present performance measures with charts and tables
- Learn to use dimensions and expressions in QlikView objects
- Utilise QlikView's built-in aggregation functions to achieve complex calculations
- Create Point In Time reporting and achieving complex calculations using Set Analysis
- Design a consistent and interactive user interface
- Ensure your QlikView applications and data are protected
- Construct a data architecture that supports scalable QlikView deployments
- Learn time-saving techniques for making your QlikView development more efficient
Table of Contents
- Meet QlikView
- Seeing is Believing
- Data Sources
- Data Modeling
- Styling Up
- Building Dashboards
- Scripting
- Data Modeling Best Practices
- Basic Data Transformation
- Advanced Expressions
- Set Analysis and Point In Time Reporting
- Advanced Data Transformation
- More on Visual Design and User Experience
- Security
QlikView for Developers Cookbook
Kindle Edition
Kindle Edition
In Detail
QlikView has been around since 1993, but has only really taken off in recent years as a leader in the in-memory BI space and, more recently, in the data discovery area. QlikView features the ability to consolidate relevant data from multiple sources into a single application, as well as an associative data model to allow you to explore the data to a way your brain works, state-of-the-art visualizations, dashboard, analysis and reports, and mobile data access.
QlikView for Developers Cookbook builds on your initial training and experiences with QlikView to help you become a better developer. This book features plenty of hands-on examples of many challenging functions.
Assuming a basic understanding of QlikView development, this book provides a range of step-by-step exercises to teach you different subjects to help build your QlikView developer expertise.
From advanced charting and layout to set analysis; from advanced aggregations through to scripting, performance, and security, this book will cover all the areas that you need to know about.
The recipes in this book will give you a lot of the information that you need to become an excellent QlikView developer.
Approach
The recipes in this Cookbook provide a concise yet practical guide on how to become an excellent QlikView developer. The book begins with intermediate level recipes and then moves on to more complex recipes in an incremental manner.
Who this book is for
This book is for anyone who has either attended QlikView Developer training or has taught themselves QlikView from books or online sources. You might be working for a QlikView customer, partner, or even QlikView themselves (or want to!) and want to improve your QlikView skills.
QlikView Scripting
Paperback – November 25, 2013
Paperback – November 25, 2013
QlikView for Finance
1st Edition, Kindle Edition
1st Edition, Kindle Edition
About This Book
- Get accustomed to QlikView features for effective data analysis and visualization in Finance
- Employ the Memory data store, which refreshes data in real time, providing a faster response to business financial information
- A step-by step guide to using Qlikview features such as key performance indicators, interactive charts, and tables for financial analysis
Who This Book Is For
If you are a finance professional with basic knowledge of QlikView functions and wish to increase your knowledge of QlikView to apply it in the field of finance, then this book is for you. A good knowledge of financial aspects is an must-have.
What You Will Learn
- Design Key Performance Indicators and extend your revenue ratio reporting
- Set up actions within a Text Object and create variables to make a chart toggle between visible and not visible
- Merge data from multiple sources to get more asset management options
- Examine good and bad practices in dashboard design and create a Group button to make more data available in less space
- Analyse the sales dashboard by adding tending lines and forecasting
- Create input boxes and use the input in formulas to perform “What If” analysis
- Examine the Key Performance Indicator (KPI) and Inventory Turnover, and investigate the usefulness of Pivot
- Create a QlikView analysis document and add data to it to gain deep insights
In Detail
This book is an effective step-by-step tutoring guide for financial analysis using Qlikview.
It begins by teaching you the crucial concepts of Qlikview Finance to help you develop an effective understanding of financial data analysis and finance. The book then goes on to cover real-world, practical examples on the use of Qlikview for financial planning and analysis, expense management, risk management, and more.
Moving on, topics such as Asset Management QlikView Dashboard and Retail Sales Analysis are covered in a strategic way. We then shift the focus to deal with the concepts of Inventory, Supply Chain, and Plant Coverage Dashboards. The book then reaches its conclusion by dealing with ways to share your QlikView insights. By the end of this book, you will have a good understanding of how to use Qlikview for numerous applications in finance.
Style and approach
This book is designed to explore what can be done in QlikView to facilitate Financial Analysis. It follows a step-by-step approach and each chapter has easy-to-follow, hands-on examples of important concepts.
QlikView for Developers: Design and build scalable and maintainable BI solutions
1st Edition, Kindle Edition
1st Edition, Kindle Edition
About This Book
- Develop your own scalable and maintainable QlikView applications
- Learn time-saving techniques for making your QlikView development more efficient
- A one-stop guide to developing BI applications with QlikView
Who This Book Is For
This book is for anyone interested in working with QlikView or who has attended QlikView Developer training. The book caters for all QlikView developers, beginners and experts alike, and anyone who wants to improve their QlikView skills.
What You Will Learn
- Understand important changes made in QlikView 12
- Learn the techniques and best practices to transform data in QlikView via scripts
- Load data from disparate sources to build an associative Data Model
- Build robust data models and overcome common modeling challenges
- Designing data visualization objects to present performance measures with charts and tables
- Learn to use dimensions and expressions in QlikView objects
- Utilize QlikView's built-in aggregation functions to achieve complex calculations
- Create Point In Time reporting and achieving complex calculations using Set Analysis
- Create a consistent and interactive user interface
- Ensure your QlikView applications and data are protected
- Optimize the QlikView Data Model
- Constructing a data architecture that supports scalable QlikView deployments
- Learn time-saving techniques for making your QlikView development more efficient
In Detail
QlikView is one of the most flexible and powerful Business Intelligence platforms around. If you want to build data into your organization, build it around QlikView. Don't get caught in the gap between data and knowledge – find out how QlikView can help you unlock insights and data potential with ease.
Whether you're new to QlikView or want to get up to speed with the features and functionality of QlikView, this book starts at a basic level and delves more deeply to demonstrate how to make QlikView work for you, and make it meet the needs of your organization. Using a real-world use-case to highlight the extensive impact of effective business analytics, this book might well be your silver bullet for success.
A superb hands-on guide to get you started by exploring the fundamentals of QlikView before learning how to successfully implement it, technically and strategically. You'll learn valuable tips, tricks, and insightful information on loading different types of data into QlikView, and how to model it effectively.
You will also learn how to write useful scripts for QlikView to handle potentially complex data transformations in a way that is simple and elegant. From ensuring consistency and clarity in your data models, to techniques for managing expressions using variables, this book makes sure that your QlikView projects are organized in a way that's most productive for you and key stakeholders.
Style and approach
This book will help you learn QlikView Development from a basic to a practitioner level using a step-by-step approach. It is smartly built around a practical case study – HighCloud Airlines – to help you gain an in-depth understanding of how to build applications for Business Intelligence using QlikView."
QlikView Scripting
Paperback – November 25, 2013
Paperback – November 25, 2013

QlikView Unlocked
1st Edition, Kindle Edition
1st Edition, Kindle Edition
About This Book
- Learn QlikView development best practices from the experts
- Discover valuable tips, tricks, and undocumented features
- A fast-paced guide with techniques and best practices to optimize high-performance, robust, and scalable applications
Who This Book Is For
QlikView Unlocked is intended for anyone with at least some experience in designing, developing, or supporting QlikView applications. Whether you are new to QlikView or are a seasoned developer, there is something for everyone in this book.
What You Will Learn
- Build the QlikView environment correctly so that it is flexible and robust
- Deliver a successful QlikView project
- Understand and implement QlikView best practices
- Discover the best way to prototype, develop, and deploy applications
- Overcome data modeling challenges
- Explore the in's and out's of Section Access
- Solve post-deployment issues in Server and Publisher
In Detail
QlikView is considered as one of the most used tool for Business Intelligence (BI). An efficient BI tool should provide five important capabilities for effective data analysis—collection (gathering important information), reporting, analysis (the ability to interact with data), visualization (the presentation of data), and discovery (exploring data). QlikView offers all these necessary skills required to deal with big data in real-world scenarios.
QlikView Unlocked will provide you with new insights to get the very best from QlikView. This book will help you to develop skills to work with data efficiently. We will cover all the secrets of unleashing the full power of QlikView, which will enable you to make better use of the tool and create better results for future projects.
In the course of this book, we will walk you through techniques and best practices that will enable you to be more productive. You will gain quick insights into the tool with the help of short steps called ”keys,” which will help you discover new features of QlikView. Moving on you will learn new techniques for data visualization, scripting, data modeling, and more. This book will then cover best practices to help you establish an efficient system with improved performance. We will also teach you some tricks that will help you speed up development processes, monitor data with dashboards, and so on.
By the end of this book, you will have gained beneficial tips, tricks, and techniques to enhance the overall experience of working with QlikView.
Style and approach
Written in a fairly informal style, this is a book that can be read cover-to-cover or simply used as a ”how-to” reference. Using real-world examples with clear explanations, code samples, and screenshots, you will be able understand each topic fully. You will be able to apply the knowledge gained to your QlikView projects."
QlikView for Developers Cookbook
Kindle Edition
Kindle Edition

In Detail
QlikView has been around since 1993, but has only really taken off in recent years as a leader in the in-memory BI space and, more recently, in the data discovery area. QlikView features the ability to consolidate relevant data from multiple sources into a single application, as well as an associative data model to allow you to explore the data to a way your brain works, state-of-the-art visualizations, dashboard, analysis and reports, and mobile data access.
QlikView for Developers Cookbook builds on your initial training and experiences with QlikView to help you become a better developer. This book features plenty of hands-on examples of many challenging functions.
Assuming a basic understanding of QlikView development, this book provides a range of step-by-step exercises to teach you different subjects to help build your QlikView developer expertise.
From advanced charting and layout to set analysis; from advanced aggregations through to scripting, performance, and security, this book will cover all the areas that you need to know about.
The recipes in this book will give you a lot of the information that you need to become an excellent QlikView developer.
Approach
The recipes in this Cookbook provide a concise yet practical guide on how to become an excellent QlikView developer. The book begins with intermediate level recipes and then moves on to more complex recipes in an incremental manner.
Who this book is for
This book is for anyone who has either attended QlikView Developer training or has taught themselves QlikView from books or online sources. You might be working for a QlikView customer, partner, or even QlikView themselves (or want to!) and want to improve your QlikView skills.
QlikView Essentials
1st Edition, Kindle Edition
1st Edition, Kindle Edition
Key Features
- Design interactive dashboards using QlikView to share sharp BI insights
- Discover how to create effective data models to manage and harness your data with QlikView's ETL functionality
- Learn and implement best practices to successfully integrate QlikView within your organization
Book Description
This guide demonstrates just how easy it is to get started with QlikView and create your own BI application. Featuring an introduction to its core features before exploring how to load data and model it, you'll soon become more confident that you can take full advantage of QlikView's capabilities. You will also learn how to use QVD files with QlikView – and how they offer a simpler way of handling data.
After digging deeper into data handling, as you learn how to use mapping tables and create a master calendar, you'll then find out how to get the most from QlikView's visualization features – vital if you are to use your data insights effectively. From accessible and user friendly dashboards to strategies and best practices for subjecting data to further analysis, you can be confident that you'll be prepared to get the most out of your data with QlikView.
With details on how to finally secure your application and deploy it for a successful integration in your organization, QlikView Essentials underlines exactly why QlikView is becoming more and more popular for businesses that understand the value of data.
What you will learn
- Learn the complete QlikView workflow – from loading data, to visualization and analytics
- Learn how to Load data from different sources, including QVD files and how to optimize data models for accuracy and precision
- Discover solutions to common data modeling problems, so you can respond quickly to changing situations
- Create accessible dashboards and quality data visualizations to share insights effectively
- Learn how to deploy your BI application for optimal availability
About the Author
Chandraish Sinha is a Business Intelligence enthusiast from Ohio. He brings 17 years of experience in providing cost-effective BI solutions.
He is responsible for many QlikView implementations in various industries, namely financial, insurance, pharmaceuticals, and event management. He currently holds QlikView Designer and QlikView Developer certifications.
He shares his knowledge and passion through his QlikView blog (http://www.learnallbi.com/).
He currently works as an independent BI consultant and helps organizations in implementing BI solutions.
Table of Contents
- QlikView Fundamentals
- Extract, Transform, and Load
- Optimizing Your Data Model
- Data Modeling Challenges
- Creating Dashboards
- Comparative Analysis
- Securing Your Application
- Application Deployment
Predictive Analytics Using Rattle and Qlik Sense
Kindle Edition
Kindle Edition
Qlik Sense Desktop, the personal and free version of Qlik Sense, is a powerful tool for business analysts to analyze data and create useful data applications. Rattle, developed in R, is a GUI used for data mining and complements Qlik Sense Desktop very well. By combining Rattle and Qlik Sense Desktop, a business user can learn how to apply predictive analytics to create real-world data applications. The objective is to use Qlik Sense to analyze data and complement it with predictive analytics using Rattle.
This book will introduce you to basic predictive analysis techniques using Rattle and basic data visualizations concepts using Qlik Sense Desktop. You will start by setting up Qlik Sense Desktop, R, and Rattle and learn the basic of these tools. Then this book will examine the data and make it ready to be analyzed. After that, you will get to know the key concepts of predictive analytics, by building simple models with Rattle and creating visualizations with Qlik Sense Desktop. Finally, the book will show you the basics of data visualization and will help you to create your first data application and dashboard.
Learning QlikView Data Visualization
Mastering QlikView
Kindle Edition
Kindle Edition
Unleash the power of QlikView and Qlik Sense to make optimum use of data for Business Intelligence
About This Book
- Learn the best ways to load data to optimize the QlikView experience
- Display data in a way that is easy to understand for most number of users
- Discover advanced expressions and scripting techniques with lots of code and screenshots
Who This Book Is For
If you are a business application developer or a system analyst who has learned QlikView and Qlik Sense and now want to take your learning to a higher level, then this book is for you.
It is assumed that you are aware of the fundamentals of QlikView and have working knowledge of development and in-memory analytics.
What You Will Learn
- Tune your Qlik applications and review basic performance-tuning techniques for scalability
- Model your data correctly using industry best approaches
- Get to know the best practices for data loading and understand QVDs to implement an ETL approach
- Discover a range of techniques to manage metadata including the QlikView Governance Dashboard
- Use advanced expression techniques to get the right answers
- Write great scripts to load data in different ways
- Visualize data using a set of analytical and advanced charting techniques
In Detail
QlikView and its new sister product, Qlik Sense, are the leading tools for BI and data discovery. They both feature the ability to consolidate relevant data from multiple sources into a single application, an associative data model to allow you to explore the data the way your brain works, and state-of-the-art visualizations, dashboards, analysis, and reports.
The book starts by reviewing the best performance-tuning techniques and then advances to help you discover strategies to improve performance and test scalability with JMeter. You will also learn dimensional data modeling and creating best-practice ETL techniques using the QlikView script and QlikView's graphical ETL tool, Expressor. Following this, you will deploy QlikView Governance Dashboard to import multiple data sources and view all the information in a single location. Finally, you will learn why virtualization is important and what are the best practices for virtualization in QlikView.
QlikView Server and Publisher
Kindle Edition
Kindle Edition
Deploy and manage QlikView Server and QlikView Publisher on platforms ranging from a single server to a multiserver clustered environment
About This Book
- Learn how to install and utilize the feature-rich QlikView with a step-by-step approach
- Configure the appropriate environment for your server implementation
- Discover how to shield your QlikView server by implementing third-party security
- Share and manage your data using the QlikView Publisher
Who This Book Is For
If you are a server administrator wanting to learn about how to deploy QlikView Server for server management,analysis and testing, and QlikView Publisher for publishing of business content then this is the perfect book for you. No prior experience with QlikView is expected.
What You Will Learn
- Choose the correct operating system and configuration to run QlikView Server/Publisher
- Install a basic server and understand how it works
- Deploy an enterprise class QlikView Server system
- Install a QlikView Publisher
- Create tasks with QMC Publisher Components
- Integrate with third party security platforms
- Monitor and troubleshoot your implementation
In Detail
QlikView is the most flexible enterprise Business Intelligence platform for transforming information into knowledge. Users can effectively consolidate relevant data from multiple sources into a single application, create reports, and visualize content for unprecedented business insight using QlikView. QlikView Server allows the nesting of multiple servers for data load balancing and enables users to access data using their PC and mobile devices. QlikView Publisher ensures that the right information reaches the right user at the right time, and gives further centralized administration and management.
Starting with the basics of QlikView Server, this book will show you how to deploy and manage your clustered environment. You will also learn how to share your data using QlikView Publisher.
With extensive practical examples and quality screenshots, the book starts by giving you a detailed understanding of QlikView Server and will proceed to help you get to grips with managing the server. From deploying a simple QlikView Server on a single-box, to an enterprise deployment on multiple servers, to alternative authentication options, you will learn all the areas that you need to know about.
Finally, you will learn how to share and manage your data using QlikView Publisher, which includes discovering the optimal configurations of QlikView. This book will enable you to effectively manage your QlikView Server and Publisher."
Naked Statistics: Stripping the Dread from the Data
1st Edition
1st Edition
"Brilliant, funny…the best math teacher you never had." ―San Francisco Chronicle
Once considered tedious, the field of statistics is rapidly evolving into a discipline Hal Varian, chief economist at Google, has actually called ""sexy."" From batting averages and political polls to game shows and medical research, the real-world application of statistics continues to grow by leaps and bounds. How can we catch schools that cheat on standardized tests? How does Netflix know which movies you’ll like? What is causing the rising incidence of autism? As best-selling author Charles Wheelan shows us in Naked Statistics, the right data and a few well-chosen statistical tools can help us answer these questions and more.
For those who slept through Stats 101, this book is a lifesaver. Wheelan strips away the arcane and technical details and focuses on the underlying intuition that drives statistical analysis. He clarifies key concepts such as inference, correlation, and regression analysis, reveals how biased or careless parties can manipulate or misrepresent data, and shows us how brilliant and creative researchers are exploiting the valuable data from natural experiments to tackle thorny questions.
And in Wheelan’s trademark style, there’s not a dull page in sight. You’ll encounter clever Schlitz Beer marketers leveraging basic probability, an International Sausage Festival illuminating the tenets of the central limit theorem, and a head-scratching choice from the famous game show Let’s Make a Deal―and you’ll come away with insights each time. With the wit, accessibility, and sheer fun that turned Naked Economics into a bestseller, Wheelan defies the odds yet again by bringing another essential, formerly unglamorous discipline to life.
KPI Mega Library: 36,000 Key Performance Indicators
Paperback – October 28, 2016
Paperback – October 28, 2016

The purpose of this guide book is to give the reader a quick and effective access to the most appropriate Key Performance Indicator (KPI). The 36,000 KPIs are categorized in a logical and alphabetical order. Many organizations are spending a lot of funds on building their strategic planning and performance management capabilities. One of the current challenges is the difficulty to know what KPIs are used in similar situations. This book main objective is to acquaint the reader with available KPIs measuring performance of a specific industry, sector, international topic, and functional area. The book is divided into three sections:1) Organization Section: 32 Industries 385 Functions 11,000 KPIs2) Government Section: 32 Sectors 457 Functions 12,000 KPIs3) International Section: 24 Topics 39 Sources 13,000 KPIsREVIEWS: "It's very interesting book. Let me also use this opportunity to congratulate you on it" Augustine Botwe, M&E Consultant – Sweden "Thank you for this book. As an OD and performance consultant, it will be great to have a reference like this to help assist clients and not reinvent the wheel. Congratulations on making this happen with admiration" Sheri Chaney Jones – Ohio, USA"Fabulous book! I bought it for my company. Good work!" Elizabeth Amini, CEO, Strategist – LA, USA"Congratulations for this tremendous work you have done with this book!" Roxana Goldstein, Monitoring Consultant – Argentina "This looks like a very important reference for me in my BSC consulting practice." Edy Chakra, Partner, ADDIMA Consulting – UK"Congratulations for your book, it is very comprehensive!" Rafael Lemaitre – Manager at Palladium Group – Spain"Many thanks for sharing this valuable information. I will use as reference in my work." Edi Indriyotomo – Senior IT Mgr. – Indonesia"I am reading my copy of your great book "KPI Mega Library" which I bought from Amazon. Thank you, great effort!" Basel A – Kuwait"It's a great idea, for folks who don't have a clue where to start. If you're a strategy consultant who shapes strategies for your clients, you need a tailored set of performance metrics" Shelley Somerville, Social Change Strategist – LA, USA"A very comprehensive list of KPIs across a number of functions, industries, etc. As an organizational consultant, I could use this resource as a jumping off point to discuss KPIs with a client based on their particular needs. This book could be a great tool to pick and choose the correct KPIs based on a number of criteria" Anthony Bussard – Dynamic, Innovative HR Effectiveness Consultant – Boston
Business Ratios and Formulas: A Comprehensive Guide
2nd Edition
2nd Edition
Required reading for anyone starting, running, or growing a business, Business Ratios and Formulas, Second Edition puts answers at the fingertips of business managers, with nearly 250 operational criteria and clear, easy-to-understand explanations that can be used right away. The Second Edition includes approximately fifty new ratios and formulas, as well as new chapters covering ratios and formulas for e-commerce and human resources.
Power BI

Learn Power BI: A beginner’s guide to developing interactive business intelligence solutions using Microsoft Power BI
Solve business challenges with Microsoft Power BI’s advanced visualization and data analysis techniques
Key Features
- Create effective storytelling reports by implementing simple-to-intermediate Power BI features
- Develop powerful analytical models to extract key insights for changing business needs
- Build, publish, and share impressive dashboards for your organization
Book Description
To succeed in today's transforming business world, organizations need business intelligence capabilities to make smarter decisions faster than ever before. This Power BI book is an entry-level guide that will get you up and running with data modeling, visualization, and analytical techniques from scratch.
You'll find this book handy if you want to get well-versed with the extensive Power BI ecosystem. You'll start by covering the basics of business intelligence and installing Power BI. You'll then learn the wide range of Power BI features to unlock business insights. As you progress, the book will take you through how to use Power Query to ingest, cleanse, and shape your data, and use Power BI DAX to create simple to complex calculations. You'll also be able to add a variety of interactive visualizations to your reports to bring your data to life. Finally, you'll gain hands-on experience in creating visually stunning reports that speak to business decision makers, and see how you can securely share these reports and collaborate with others.
By the end of this book, you'll be ready to create simple, yet effective, BI reports and dashboards using the latest features of Power BI.
What you will learn
- Explore the different features of Power BI to create interactive dashboards
- Use the Query Editor to import and transform data
- Perform simple and complex DAX calculations to enhance analysis
- Discover business insights and tell a story with your data using Power BI
- Explore data and learn to manage datasets, dataflows, and data gateways
- Use workspaces to collaborate with others and publish your reports
Who this book is for
If you're an IT manager, data analyst, or BI user new to using Power BI for solving business intelligence problems, this book is for you. You'll also find this book useful if you want to migrate from other BI tools to create powerful and interactive dashboards. No experience of working with Power BI is expected.
Table of Contents
- Introduction to Business Intelligence and Power BI
- Up and Running with Power BI Desktop
- Connecting and Shaping Data
- Creating Data Models and Calculations
- Unlocking Insights
- Creating the Final Report
- Publishing and Sharing
- Using Reports in the Service
- Understanding Dashboards, Apps and Security
- Data Gateways and Refreshing Datasets
Mastering Microsoft Power BI: Expert techniques to create interactive insights for effective data analytics and business intelligence, 2nd Edition
2nd ed. Edition
2nd ed. Edition

Plan, design, develop, and manage robust Power BI solutions to generate meaningful insights and make data-driven decisions.
Purchase of the print or Kindle book includes a free eBook in the PDF format.
Key Features
- Master the latest dashboarding and reporting features of Microsoft Power BI
- Combine data from multiple sources, create stunning visualizations and publish Power BI apps to thousands of users
- Get the most out of Microsoft Power BI with real-world use cases and examples
Book Description
Mastering Microsoft Power BI, Second Edition, provides an advanced understanding of Power BI to get the most out of your data and maximize business intelligence. This updated edition walks through each essential phase and component of Power BI, and explores the latest, most impactful Power BI features.
Using best practices and working code examples, you will connect to data sources, shape and enhance source data, and develop analytical data models. You will also learn how to apply custom visuals, implement new DAX commands and paginated SSRS-style reports, manage application workspaces and metadata, and understand how content can be staged and securely distributed via Power BI apps. Furthermore, you will explore top report and interactive dashboard design practices using features such as bookmarks and the Power KPI visual, alongside the latest capabilities of Power BI mobile applications and self-service BI techniques. Additionally, important management and administration topics are covered, including application lifecycle management via Power BI pipelines, the on-premises data gateway, and Power BI Premium capacity.
By the end of this Power BI book, you will be confident in creating sustainable and impactful charts, tables, reports, and dashboards with any kind of data using Microsoft Power BI.
What you will learn
- Build efficient data retrieval and transformation processes with the Power Query M language and dataflows
- Design scalable, user-friendly DirectQuery, import, and composite data models
- Create basic and advanced DAX measures
- Add ArcGIS Maps to create interesting data stories
- Build pixel-perfect paginated reports
- Discover the capabilities of Power BI mobile applications
- Manage and monitor a Power BI environment as a Power BI administrator
- Scale up a Power BI solution for an enterprise via Power BI Premium capacity
Who this book is for
Business Intelligence professionals and intermediate Power BI users looking to master Power BI for all their data visualization and dashboarding needs will find this book useful. An understanding of basic BI concepts is required and some familiarity with Microsoft Power BI will be helpful to make the most out of this book.
Table of Contents
- Planning Power BI Projects
- Preparing Data sources
- Connecting to Sources and Transforming Data with M
- Designing Import, DirectQuery, and Composite Data Models
- Developing DAX Measures and Security Roles
- Planning Power BI Reports
- Creating and Formatting Visualizations
- Applying Advanced Analytics
- Designing Dashboards
- Managing Workspaces and Content
- Managing the On-Premises Data Gateway
- Deploying Paginated Reports
- Creating Power BI Apps and Content Distribution
- Administering Power BI for an Organization
- Building Enterprise BI with Power BI Premium
Microsoft Power BI Cookbook: Creating Business Intelligence Solutions of Analytical Data Models, Reports, and Dashboards
Microsoft Power BI is a business intelligence and analytics platform consisting of applications and services designed to provide coherent, visual and interactive insights of data.
Key Features
- From connecting to your data sources to developing and deploying immersive, mobile-ready dashboards and visualizations, this book covers it all
- Over 90 hands-on, technical recipes, tips, and use cases from across the Power BI platform including the Power BI Service and Mobile Applications
- Proven development techniques and guidance for implementing custom solutions with DAX and M languages
Book Description
This book will provide thorough, technical examples of using all primary Power BI tools and features as well as demonstrate high impact end-to-end solutions that leverage and integrate these technologies and services. Get familiar with Power BI development tools and services, go deep into the data connectivity and transformation, modeling, visualization and analytical capabilities of Power BI, and see Power BI’s functional programming languages of DAX and M come alive to deliver powerful solutions to address common, challenging scenarios in business intelligence.
This book will excite and empower you to get more out of Power BI via detailed recipes, advanced design and development tips, and guidance on enhancing existing Power BI projects.
What you will learn
- Cleanse, stage, and integrate your data sources with Power BI
- Abstract data complexities and provide users with intuitive, self-service BI capabilities
- Build business logic and analysis into your solutions via the DAX programming language and dynamic, dashboard-ready calculations
- Take advantage of the analytics and predictive capabilities of Power BI
- Make your solutions more dynamic and user specific and/or defined including use cases of parameters, functions, and row level security
- Understand the differences and implications of DirectQuery, Live Connections, and Import-Mode Power BI datasets and how to deploy content to the Power BI Service and schedule refreshes
- Integrate other Microsoft data tools such as Excel and SQL Server Reporting Services into your Power BI solution
About the Author
Brett Powell is the owner of and business intelligence consultant at Frontline Analytics LLC, a data and analytics research and consulting firm and Microsoft Power BI partner. He has worked with Power BI technologies since they were first introduced as the SQL Server 2008R2 PowerPivot add-in for Excel 2010. He has contributed to the design and development of Microsoft and Power BI solutions of diverse scale and complexity across the retail, manufacturing, financial, and services industries. Brett regularly blogs and shares technical papers regarding the latest MSBI and Power BI features and development techniques and patterns at Insight Quest. He is also an organizer of the Boston BI User Group.
Table of Contents
- Configuring Your Power BI Development Tools
- Accessing and Retrieving Data
- Building a Power BI Data Model
- Authoring Power BI Reports
- Creating Power BI Dashboards
- Getting Serious with Date Intelligence
- Parameterizing Your Power BI Solutions
- Implementing Dynamic User-Based Visibility in Power BI
- Applying Advanced Analytics and Custom Visuals
- Developing Solutions for System Monitoring and Administration
- Enhancing and Optimizing Existing Power BI Solutions
- Deploying and Distributing Power BI Content
- Integrating Power BI with other Applications
Microsoft Power BI Quick Start Guide: Build dashboards and visualizations to make your data come to life
Key Features
- Get to grips with the fundamentals of Microsoft Power BI and its Business Intelligence capabilities
- Build accurate analytical models, reports and dashboards
- Get faster and more intuitive insights from your data using Microsoft Power BI
Book Description
Microsoft Power BI is a cloud-based service that helps you easily visualize and share insights using your organization's data.This book will get you started with business intelligence using the Power BI toolset, covering essential concepts such as installation,designing effective data models, as well as building basic dashboards and visualizations to make your data come to life
You will learn how to get your data the way you want – connecting to data sources sources and how to clean your data with the Power BI Query Editor. You will next learn how to properly design your data model to make your data easier to work with.. You will next learn how to properly design your data model to navigate table relationships and build DAX formulas to make your data easier to work with.
Visualizing your data is another key element of this book, and you will learn how to follow proper data visualization styles and enhanced digital storytelling techniques.
By the end of this book, you will understand how to administer your organization's Power BI environment so deployment can be made seamless, data refreshes can run properly, and security can be fully implemented
What you will learn
- Connect to data sources using both import and DirectQuery options
- Use the Query Editor to apply data transformations and data cleansing processes, including learning how to write M and R scripts
- Design optimized data models by designing relationships and DAX calculations
- Leverage built-in and custom visuals to design effective reports
- Use the Power BI Desktop and Power BI Service to implement Row Level Security on your model
- Administer a Power BI cloud tenant for your organization
- Deploy your Power BI Desktop files into the Power BI Report Server
Who this book is for
This book is for aspiring Business Intelligence professionals who want to get up and running with Microsoft Power BI. If you have a basic understanding of BI concepts and want to learn how to apply them using Microsoft Power BI, this book is for you.
Table of Contents
- Getting Started with Importing Data Options
- Data Transformation Strategies
- Building the Data Model
- Leveraging DAX
- Visualizing Data
- Digital Storytelling with Power BI
- Using a Cloud Deployment with the Power BI Service
- On-Premises Solutions with Power BI Report Server
Pro Power BI Architecture: Sharing, Security, and Deployment Options for Microsoft Power BI Solutions
This book will help you understand the many available options and choose the best combination for hosting, developing, sharing, and deploying a Power BI solution within your organization.
Pro Power BI Architecture provides detailed examples and explains the different methods available for sharing and securing Power BI content so that only intended recipients can see it. Commonly encountered problems you will learn to handle include content unexpectedly changing while users are in the process of creating reports and building analysis, methods of sharing analyses that don’t cover all the requirements of your business or organization, and inconsistent security models.
The knowledge provided in this book will allow you to choose an architecture and deployment model that suits the needs of your organization, ensuring that you do not spend your time maintaining your solution but on using it for its intended purpose and gaining business value from mining and analyzing your organization’s data.
What You'll Learn
- Architect and administer enterprise-level Power BI solutions
- Choose the right sharing method for your Power BI solution
- Create and manage environments for development, testing, and production
- Implement row level security in multiple ways to secure your data
- Save money by choosing the right licensing plan
- Select a suitable connection type—Live Connection, DirectQuery, or Scheduled Refresh—for your use case
- Set up a Power BI gateway to bridge between on-premises data sources and the Power BI cloud service
Who This Book Is For
Data analysts, developers, architects, and managers who want to leverage Power BI for their reporting solution"
Beginning Power BI: A Practical Guide to Self-Service Data Analytics with Excel 2016 and Power BI Desktop
Paperback – January 1, 2017
Paperback – January 1, 2017
Excel 2016 for Marketing Statistics: A Guide to Solving Practical Problems (Excel for Statistics)
1st ed. 2016 Edition, Kindle Edition
1st ed. 2016 Edition, Kindle Edition
This is the first book to show the capabilities of Microsoft Excel in teaching marketing statistics effectively. It is a step-by-step exercise-driven guide for students and practitioners who need to master Excel to solve practical marketing problems. If understanding statistics isn’t your strongest suit, you are not especially mathematically-inclined, or if you are wary of computers, this is the right book for you.
Excel, a widely available computer program for students and managers, is also an effective teaching and learning tool for quantitative analyses in marketing courses. Its powerful computational ability and graphical functions make learning statistics much easier than in years past. However, Excel 2016 for Marketing Statistics: A Guide to Solving Practical Problems is the first book to capitalize on these improvements by teaching students and managers how to apply Excel to statistical techniques necessary in their courses and work.
Each chapter explains statistical formulas and directs the reader to use Excel commands to solve specific, easy-to-understand marketing problems. Practice problems are provided at the end of each chapter with their solutions in an appendix. Separately, there is a full Practice Test (with answers in an Appendix) that allows readers to test what they have learned.
Excel 2016 Power Programming with VBA (Mr. Spreadsheet’s Bookshelf)
1st Edition
1st Edition
Excel 2016 Power Programming with VBA is fully updated to cover all the latest tools and tricks of Excel 2016. Encompassing an analysis of Excel application development and a complete introduction to Visual Basic for Applications (VBA), this comprehensive book presents all of the techniques you need to develop both large and small Excel applications. Over 800 pages of tips, tricks, and best practices shed light on key topics, such as the Excel interface, file formats, enhanced interactivity with other Office applications, and improved collaboration features. In addition to the procedures, tips, and ideas that will expand your capabilities, this resource provides you with access to over 100 online example Excel workbooks and the Power Utility Pak, found on the Mr. Spreadsheet website.
Understanding how to leverage VBA to improve your Excel programming skills can enhance the quality of deliverables that you produce―and can help you take your career to the next level.
- Explore fully updated content that offers comprehensive coverage through over 900 pages of tips, tricks, and techniques
- Leverage templates and worksheets that put your new knowledge in action, and reinforce the skills introduced in the text
- Access online resources, including the Power Utility Pak, that supplement the content
- Improve your capabilities regarding Excel programming with VBA, unlocking more of your potential in the office
Excel 2016 Power Programming with VBA is a fundamental resource for intermediate to advanced users who want to polish their skills regarding spreadsheet applications using VBA.
Power Pivot and Power BI: The Excel User’s Guide to DAX, Power Query, Power BI & Power Pivot in Excel 2010-2016
Second edition
Second edition
Microsoft PowerPivot is a free add-on to Excel from Microsoft that allows users to produce new kinds of reports and analyses that were simply impossible before, and this book is the first to tackle DAX formulas, the core capability of PowerPivot, from the perspective of the Excel audience. Written by the world's foremost PowerPivot blogger and practitioner, the book's concepts and approach are introduced in a step-by-step manner tailored to the learning style of Excel users everywhere. The techniques presented allow users to produce, in hours or even minutes, results that formerly would have taken entire teams weeks or months to produce. The "pattern-like" techniques and best practices contained in this book have been developed and refined over two years of onsite training with Excel users around the world, and the key lessons from those seminars costing thousands of dollars per day are now available within the pages of this easy-to-follow guide. This updated edition covers new features introduced with Office 2015.
Collect, Combine, and Transform Data Using Power Query in Excel and Power BI (Business Skills)
1st Edition
1st Edition
Did you know that there is a technology inside Excel, and Power BI, that allows you to create magic in your data, avoid repetitive manual work, and save you time and money?
Using Excel and Power BI, you can:
- Save time by eliminating the pain of copying and pasting data into workbooks and then manually cleaning that data.
- Gain productivity by properly preparing data yourself, rather than relying on others to do it.
- Gain effiiciency by reducing the time it takes to prepare data for analysis, and make informed decisions more quickly.
With the data connectivity and transformative technology found in Excel and Power BI, users with basic Excel skills import data and then easily reshape and cleanse that data, using simple intuitive user interfaces. Known as “Get & Transform” in Excel 2016, as the “Power Query” separate add-in in Excel 2013 and 2010, and included in Power BI, you'll use this technology to tackle common data challenges, resolving them with simple mouse clicks and lightweight formula editing. With your new data transformation skills acquired through this book, you will be able to create an automated transformation of virtually any type of data set to mine its hidden insights."
Microsoft Power BI Cookbook: Gain expertise in Power BI with over 90 hands-on recipes, tips, and use cases, 2nd Edition
Build effective analytical data models, reports, and dashboards using the advanced features of Power BI.
Purchase of the print or Kindle book includes a free eBook in the PDF format.
Key Features
- Update your knowledge with new recipes for query optimization, aggregation tables, Power BI API, and paginated reports
- Work with recipes across diverse Power BI platforms including the Power BI Service and Mobile Applications
- Implement custom solutions with M and DAX languages through actionable guidance and proven development techniques
Book Description
The complete everyday reference guide to Power BI, written by an internationally recognized Power BI expert duo, is back with a new and updated edition.
Packed with revised practical recipes, Microsoft Power BI Cookbook, Second Edition, helps you navigate Power BI tools and advanced features. It also demonstrates the use of end-to-end solutions that integrate those features to get the most out of Power BI. With the help of the recipes in this book, you'll gain advanced design and development insight, practical tips, and guidance on enhancing existing Power BI projects.
The updated recipes will equip you with everything you need to know to implement evergreen frameworks that will stay relevant as Power BI updates. You'll familiarize yourself with Power BI development tools and services by going deep into the data connectivity, transformation, modeling, visualization, and analytical capabilities of Power BI. By the end of this book, you'll make the most of Power BI's functional programming languages of DAX and M and deliver powerful solutions to common business intelligence challenges.
What you will learn
- Cleanse, stage, and integrate your data sources with Power Query (M)
- Remove data complexities and provide users with intuitive, self-service BI capabilities
- Build business logic and analysis into your solutions via the DAX programming language and dashboard-ready calculations
- Implement aggregation tables to accelerate query performance over large data sources
- Create and integrate paginated reports
- Understand the differences and implications of DirectQuery, live connections, Import, and Composite model datasets
- Integrate other Microsoft data tools into your Power BI solution
Who this book is for
If you're a BI professional who wants to up their knowledge of Power BI and offer more value to their organization, then this book is for you. Those looking for quick solutions to common Power BI problems will also find this book an extremely useful resource. Please be aware that this is not a beginner's guide; you'll need a solid understanding of Power BI and experience working with datasets before you dive in.
Table of Contents
- Configuring Power BI Tools
- Accessing and Retrieving Data
- Building a Power BI Data Model
- Authoring Power BI Reports
- Working in the Service
- Getting Serious with Date Intelligence
- Parameterizing Power BI Solutions
- Implementing Dynamic User-Based Visibility in Power BI
- Applying Advanced Analytics and Custom Visuals
- Administering and Monitoring Power BI
- Enhancing and Optimizing Existing Power BI Solutions
- Deploying and Distributing Power BI Content
- Integrating Power BI with Other Applications
Microsoft Power BI Cookbook: Creating Business Intelligence Solutions of Analytical Data Models, Reports, and Dashboards

Microsoft Power BI is a business intelligence and analytics platform consisting of applications and services designed to provide coherent, visual and interactive insights of data.
Key Features
- From connecting to your data sources to developing and deploying immersive, mobile-ready dashboards and visualizations, this book covers it all
- Over 90 hands-on, technical recipes, tips, and use cases from across the Power BI platform including the Power BI Service and Mobile Applications
- Proven development techniques and guidance for implementing custom solutions with DAX and M languages
Book Description
This book will provide thorough, technical examples of using all primary Power BI tools and features as well as demonstrate high impact end-to-end solutions that leverage and integrate these technologies and services. Get familiar with Power BI development tools and services, go deep into the data connectivity and transformation, modeling, visualization and analytical capabilities of Power BI, and see Power BI’s functional programming languages of DAX and M come alive to deliver powerful solutions to address common, challenging scenarios in business intelligence.
This book will excite and empower you to get more out of Power BI via detailed recipes, advanced design and development tips, and guidance on enhancing existing Power BI projects.
What you will learn
- Cleanse, stage, and integrate your data sources with Power BI
- Abstract data complexities and provide users with intuitive, self-service BI capabilities
- Build business logic and analysis into your solutions via the DAX programming language and dynamic, dashboard-ready calculations
- Take advantage of the analytics and predictive capabilities of Power BI
- Make your solutions more dynamic and user specific and/or defined including use cases of parameters, functions, and row level security
- Understand the differences and implications of DirectQuery, Live Connections, and Import-Mode Power BI datasets and how to deploy content to the Power BI Service and schedule refreshes
- Integrate other Microsoft data tools such as Excel and SQL Server Reporting Services into your Power BI solution
About the Author
Brett Powell is the owner of and business intelligence consultant at Frontline Analytics LLC, a data and analytics research and consulting firm and Microsoft Power BI partner. He has worked with Power BI technologies since they were first introduced as the SQL Server 2008R2 PowerPivot add-in for Excel 2010. He has contributed to the design and development of Microsoft and Power BI solutions of diverse scale and complexity across the retail, manufacturing, financial, and services industries. Brett regularly blogs and shares technical papers regarding the latest MSBI and Power BI features and development techniques and patterns at Insight Quest. He is also an organizer of the Boston BI User Group.
Table of Contents
- Configuring Your Power BI Development Tools
- Accessing and Retrieving Data
- Building a Power BI Data Model
- Authoring Power BI Reports
- Creating Power BI Dashboards
- Getting Serious with Date Intelligence
- Parameterizing Your Power BI Solutions
- Implementing Dynamic User-Based Visibility in Power BI
- Applying Advanced Analytics and Custom Visuals
- Developing Solutions for System Monitoring and Administration
- Enhancing and Optimizing Existing Power BI Solutions
- Deploying and Distributing Power BI Content
- Integrating Power BI with other Applications
Mastering Microsoft Power BI: Expert techniques to create interactive insights for effective data analytics and business intelligence, 2nd Edition
Plan, design, develop, and manage robust Power BI solutions to generate meaningful insights and make data-driven decisions.
Purchase of the print or Kindle book includes a free eBook in the PDF format.
Key Features
- Master the latest dashboarding and reporting features of Microsoft Power BI
- Combine data from multiple sources, create stunning visualizations and publish Power BI apps to thousands of users
- Get the most out of Microsoft Power BI with real-world use cases and examples
Book Description
Mastering Microsoft Power BI, Second Edition, provides an advanced understanding of Power BI to get the most out of your data and maximize business intelligence. This updated edition walks through each essential phase and component of Power BI, and explores the latest, most impactful Power BI features.
Using best practices and working code examples, you will connect to data sources, shape and enhance source data, and develop analytical data models. You will also learn how to apply custom visuals, implement new DAX commands and paginated SSRS-style reports, manage application workspaces and metadata, and understand how content can be staged and securely distributed via Power BI apps. Furthermore, you will explore top report and interactive dashboard design practices using features such as bookmarks and the Power KPI visual, alongside the latest capabilities of Power BI mobile applications and self-service BI techniques. Additionally, important management and administration topics are covered, including application lifecycle management via Power BI pipelines, the on-premises data gateway, and Power BI Premium capacity.
By the end of this Power BI book, you will be confident in creating sustainable and impactful charts, tables, reports, and dashboards with any kind of data using Microsoft Power BI.
What you will learn
- Build efficient data retrieval and transformation processes with the Power Query M language and dataflows
- Design scalable, user-friendly DirectQuery, import, and composite data models
- Create basic and advanced DAX measures
- Add ArcGIS Maps to create interesting data stories
- Build pixel-perfect paginated reports
- Discover the capabilities of Power BI mobile applications
- Manage and monitor a Power BI environment as a Power BI administrator
- Scale up a Power BI solution for an enterprise via Power BI Premium capacity
Who this book is for
Business Intelligence professionals and intermediate Power BI users looking to master Power BI for all their data visualization and dashboarding needs will find this book useful. An understanding of basic BI concepts is required and some familiarity with Microsoft Power BI will be helpful to make the most out of this book.
Table of Contents
- Planning Power BI Projects
- Preparing Data sources
- Connecting to Sources and Transforming Data with M
- Designing Import, DirectQuery, and Composite Data Models
- Developing DAX Measures and Security Roles
- Planning Power BI Reports
- Creating and Formatting Visualizations
- Applying Advanced Analytics
- Designing Dashboards
- Managing Workspaces and Content
- Managing the On-Premises Data Gateway
- Deploying Paginated Reports
- Creating Power BI Apps and Content Distribution
- Administering Power BI for an Organization
- Building Enterprise BI with Power BI Premium
Mastering Microsoft Power BI: Expert techniques for effective data analytics and business intelligence
Key Features
- Master all the dashboarding and reporting features of Microsoft Power BI
- Combine data from multiple sources, create stunning visualizations and publish your reports across multiple platforms
- A comprehensive guide with real-world use cases and examples demonstrating how you can get the best out of Microsoft Power BI
Book Description
This book is intended for business intelligence professionals responsible for the design and development of Power BI content as well as managers, architects and administrators who oversee Power BI projects and deployments. The chapters flow from the planning of a Power BI project through the development and distribution of content to the administration of Power BI for an organization.
BI developers will learn how to create sustainable and impactful Power BI datasets, reports, and dashboards. This includes connecting to data sources, shaping and enhancing source data, and developing an analytical data model. Additionally, top report and dashboard design practices are described using features such as Bookmarks and the Power KPI visual.
BI managers will learn how Power BI's tools work together such as with the On-premises data gateway and how content can be staged and securely distributed via Apps. Additionally, both the Power BI Report Server and Power BI Premium are reviewed.
By the end of this book, you will be confident in creating effective charts, tables, reports or dashboards for any kind of data using the tools and techniques in Microsoft Power BI.
What you will learn
- Build efficient data retrieval and transformation processes with the Power Query M Language
- Design scalable, user-friendly DirectQuery and Import Data Models
- Develop visually rich, immersive, and interactive reports and dashboards
- Maintain version control and stage deployments across development, test, and production environments
- Manage and monitor the Power BI Service and the On-premises data gateway
- Develop a fully on-premise solution with the Power BI Report Server
- Scale up a Power BI solution via Power BI Premium capacity and migration to Azure Analysis Services or SQL Server Analysis Services
Who this book is for
Business Intelligence professionals and existing Power BI users looking to master Power BI for all their data visualization and dashboarding needs will find this book to be useful. While understanding of the basic BI concepts is required, some exposure to Microsoft Power BI will be helpful.
Table of Contents
- Planning Power BI Projects
- Connecting to Sources and Transforming Data with M
- Designing Import and DirectQuery Data Models
- Developing DAX Measures and Security Roles
- Creating and Formatting Power BI Reports
- Integrating Custom Visuals, Animation and Analytics into Power BI Reports
- Designing Power BI Dashboards and Multi-Dashboard Architectures
- Managing Application Workspaces and Power BI Content
- Managing the On-Premises Data Gateway and Data Refresh Configurations
- Deploying Power BI On-Premises with the Power BI Report Server
- Creating Power BI Apps and Content Distribution
- Administering Power BI for an Organization
- Scaling Up with Power BI Premium and SQL Server Analysis Services
Mastering Microsoft Power BI: Expert techniques to create interactive insights for effective data analytics and business intelligence, 2nd Edition

Plan, design, develop, and manage robust Power BI solutions to generate meaningful insights and make data-driven decisions.
Purchase of the print or Kindle book includes a free eBook in the PDF format.
Key Features
- Master the latest dashboarding and reporting features of Microsoft Power BI
- Combine data from multiple sources, create stunning visualizations and publish Power BI apps to thousands of users
- Get the most out of Microsoft Power BI with real-world use cases and examples
- Book Description
Mastering Microsoft Power BI, Second Edition, provides an advanced understanding of Power BI to get the most out of your data and maximize business intelligence. This updated edition walks through each essential phase and component of Power BI, and explores the latest, most impactful Power BI features.
Using best practices and working code examples, you will connect to data sources, shape and enhance source data, and develop analytical data models. You will also learn how to apply custom visuals, implement new DAX commands and paginated SSRS-style reports, manage application workspaces and metadata, and understand how content can be staged and securely distributed via Power BI apps. Furthermore, you will explore top report and interactive dashboard design practices using features such as bookmarks and the Power KPI visual, alongside the latest capabilities of Power BI mobile applications and self-service BI techniques. Additionally, important management and administration topics are covered, including application lifecycle management via Power BI pipelines, the on-premises data gateway, and Power BI Premium capacity.
By the end of this Power BI book, you will be confident in creating sustainable and impactful charts, tables, reports, and dashboards with any kind of data using Microsoft Power BI.
What you will learn
- Build efficient data retrieval and transformation processes with the Power Query M language and dataflows
- Design scalable, user-friendly DirectQuery, import, and composite data models
- Create basic and advanced DAX measures
- Add ArcGIS Maps to create interesting data stories
- Build pixel-perfect paginated reports
- Discover the capabilities of Power BI mobile applications
- Manage and monitor a Power BI environment as a Power BI administrator
- Scale up a Power BI solution for an enterprise via Power BI Premium capacity
Who this book is for
Business Intelligence professionals and intermediate Power BI users looking to master Power BI for all their data visualization and dashboarding needs will find this book useful. An understanding of basic BI concepts is required and some familiarity with Microsoft Power BI will be helpful to make the most out of this book.
Table of Contents
- Planning Power BI Projects
- Preparing Data sources
- Connecting to Sources and Transforming Data with M
- Designing Import, DirectQuery, and Composite Data Models
- Developing DAX Measures and Security Roles
- Planning Power BI Reports
- Creating and Formatting Visualizations
- Applying Advanced Analytics
- Designing Dashboards
- Managing Workspaces and Content
- Managing the On-Premises Data Gateway
- Deploying Paginated Reports
- Creating Power BI Apps and Content Distribution
- Administering Power BI for an Organization
- Building Enterprise BI with Power BI Premium
BI books
A Guide to the Business Analysis Body of Knowledge® (BABOK® Guide) v3 (version)
A Guide to the Business Analysis Body of Knowledge® (BABOK® Guide) is the only globally recognized standard of practice for business analysis.
Developed through a rigorous consensus-driven standards process, the BABOK® Guide incorporates the collective wisdom and experience of experts in the field from around the world.
Previous editions have guided hundreds of thousands of professionals in their work, and it has been adopted by hundreds of enterprises as the basis of their business analysis practice. This latest version of the guide extends its scope beyond business analysis in projects to address agile development, business process management, business intelligence, and business architecture.
This thoroughly revised and updated version includes:
- A concept model that unifies ideas and terminology across business analysis disciplines.
- Restructured knowledge areas to support business analysis at every level from small tactical initiatives to major business transformations.
- Five perspectives covering the most prominent business analysis disciplines and demonstrating how to apply the knowledge areas in different situations.
- Coverage of new business analysis techniques that have gained wide acceptance in the community.
- Updated and revised content in every knowledge area and more!
Whether you are considering starting a career in business analysis, or you are an experienced professional in the field,the BABOK® Guide is your key resource to help you and your stakeholders discover opportunities for business success, deliver successful organizational change, and create business value.
A Guide to the Business Analysis Body of Knowledge (BABOK Guide)
Paperback – Illustrated, April 15, 2015
Paperback – Illustrated, April 15, 2015
A Guide to the Business Analysis Body of Knowledge® (BABOK® Guide) is the only globally recognized standard of practice for business analysis.
Developed through a rigorous consensus-driven standards process, the BABOK® Guide incorporates the collective wisdom and experience of experts in the field from around the world.
Previous editions have guided hundreds of thousands of professionals in their work, and it has been adopted by hundreds of enterprises as the basis of their business analysis practice. This latest version of the guide extends its scope beyond business analysis in projects to address agile development, business process management, business intelligence, and business architecture.
This thoroughly revised and updated version includes:
- A concept model that unifies ideas and terminology across business analysis disciplines.
- Restructured knowledge areas to support business analysis at every level from small tactical initiatives to major business transformations.
- Five perspectives covering the most prominent business analysis disciplines and demonstrating how to apply the knowledge areas in different situations.
- Coverage of new business analysis techniques that have gained wide acceptance in the community.
- Updated and revised content in every knowledge area and more!
Whether you are considering starting a career in business analysis, or you are an experienced professional in the field,the BABOK® Guide is your key resource to help you and your stakeholders discover opportunities for business success, deliver successful organizational change, and create business value.
Business Intelligence Guidebook: From Data Integration to Analytics
Between the high-level concepts of business intelligence and the nitty-gritty instructions for using vendors’ tools lies the essential, yet poorly-understood layer of architecture, design and process. Without this knowledge, Big Data is belittled – projects flounder, are late and go over budget. Business Intelligence Guidebook: From Data Integration to Analytics shines a bright light on an often neglected topic, arming you with the knowledge you need to design rock-solid business intelligence and data integration processes. Practicing consultant and adjunct BI professor Rick Sherman takes the guesswork out of creating systems that are cost-effective, reusable and essential for transforming raw data into valuable information for business decision-makers.
After reading this book, you will be able to design the overall architecture for functioning business intelligence systems with the supporting data warehousing and data-integration applications. You will have the information you need to get a project launched, developed, managed and delivered on time and on budget – turning the deluge of data into actionable information that fuels business knowledge. Finally, you’ll give your career a boost by demonstrating an essential knowledge that puts corporate BI projects on a fast-track to success.
Provides practical guidelines for building successful BI, DW and data integration solutions.
Explains underlying BI, DW and data integration design, architecture and processes in clear, accessible language.
Includes the complete project development lifecycle that can be applied at large enterprises as well as at small to medium-sized businesses
Describes best practices and pragmatic approaches so readers can put them into action.
Companion website includes templates and examples, further discussion of key topics, instructor materials, and references to trusted industry sources.
Data Governance
DAMA-DMBOK: Data Management Body of Knowledge: 2nd Edition
Second Edition
Second Edition
The Data Management Body of Knowledge (DAMA-DMBOK2) presents a comprehensive view of the challenges, complexities, and value of effective data management.
Today's organizations recognize that managing data is central to their success. They recognize data has value and they want to leverage that value. As our ability and desire to create and exploit data has increased, so too has the need for reliable data management practices.
The second edition of DAMA International's Guide to the Data Management Body of Knowledge (DAMA-DMBOK2) updates and augments the highly successful DMBOK1. An accessible, authoritative reference book written by leading thinkers in the field and extensively reviewed by DAMA members, DMBOK2 brings together materials that comprehensively describe the challenges of data management and how to meet them by:
Defining a set of guiding principles for data management and describing how these principles can be applied within data management functional areas.
Providing a functional framework for the implementation of enterprise data management practices; including widely adopted practices, methods and techniques, functions, roles, deliverables and metrics.
Establishing a common vocabulary for data management concepts and serving as the basis for best practices for data management professionals.
DAMA-DMBOK2 provides data management and IT professionals, executives, knowledge workers, educators, and researchers with a framework to manage their data and mature their information infrastructure, based on these principles:
- Data is an asset with unique properties
- The value of data can be and should be expressed in economic terms
- Managing data means managing the quality of data
- It takes metadata to manage data
- It takes planning to manage data
- Data management is cross-functional and requires a range of skills and expertise
- Data management requires an enterprise perspective
- Data management must account for a range of perspectives
- Data management is data lifecycle management
- Different types of data have different lifecycle requirements
- Managing data includes managing risks associated with data
- Data management requirements must drive information technology decisions
- Effective data management requires leadership commitment
Chapters include:
- Data Management
- Data Handling Ethics
- Data Governance
- Data Architecture
- Data Modeling and Design
- Data Storage and Operations
- Data Security
- Data Integration and Interoperability
- Document and Content Management
- Reference and Master Data
- Data Warehousing and Business Intelligence
- Metadata Management
- Data Quality Management
- Big Data and Data Science
- Data Management Maturity Assessment
- Data Management Organization and Role Expectations
- Data Management and Organizational Change Management
Standardization of data management disciplines will help data management professionals perform more effectively and consistently. It will also enable organizational leaders to recognize the value and contributions of data management activities.
DataOps: The Authoritative Edition
Kindle Edition
Kindle Edition
DataOps is an innovative breakthrough to let people use data as easily as they plan a trip around the world or buy a pair of shoes on the web. DataOps is the practice of operationalizing data movement to improve quality and accelerate delivery for new business demands for data, and to deliver continuously with confidence, in a world of ceaseless change. With DataOps you operate data rather than engineer data. In other words, it creates continuous data flows with automated processes and self-service tools so that users can discover and deliver data by themselves in a few days or hours.
Data Quality Fundamentals: A Practitioner’s Guide to Building Trustworthy Data Pipelines
1st Edition
1st Edition
Do your product dashboards look funky? Are your quarterly reports stale? Is the data set you're using broken or just plain wrong? These problems affect almost every team, yet they're usually addressed on an ad hoc basis and in a reactive manner. If you answered yes to these questions, this book is for you.
Many data engineering teams today face the ""good pipelines, bad data"" problem. It doesn't matter how advanced your data infrastructure is if the data you're piping is bad. In this book, Barr Moses, Lior Gavish, and Molly Vorwerck, from the data observability company Monte Carlo, explain how to tackle data quality and trust at scale by leveraging best practices and technologies used by some of the world's most innovative companies.
- Build more trustworthy and reliable data pipelines
- Write scripts to make data checks and identify broken pipelines with data observability
- Learn how to set and maintain data SLAs, SLIs, and SLOs
- Develop and lead data quality initiatives at your company
- Learn how to treat data services and systems with the diligence of production software
- Automate data lineage graphs across your data ecosystem
- Build anomaly detectors for your critical data assets
Data Vizualization
Visualize This: The FlowingData Guide to Design, Visualization, and Statistics
1st Edition
1st Edition
Data doesn?t decrease; it is ever-increasing and can be overwhelming to organize in a way that makes sense to its intended audience. Wouldn?t it be wonderful if we could actually visualize data in such a way that we could maximize its potential and tell a story in a clear, concise manner? Thanks to the creative genius of Nathan Yau, we can. With this full-color book, data visualization guru and author Nathan Yau uses step-by-step tutorials to show you how to visualize and tell stories with data. He explains how to gather, parse, and format data and then design high quality graphics that help you explore and present patterns, outliers, and relationships.
- Presents a unique approach to visualizing and telling stories with data, from a data visualization expert and the creator of flowingdata.com, Nathan Yau
- Offers step-by-step tutorials and practical design tips for creating statistical graphics, geographical maps, and information design to find meaning in the numbers
- Details tools that can be used to visualize data-native graphics for the Web, such as ActionScript, Flash libraries, PHP, and JavaScript and tools to design graphics for print, such as R and Illustrator
Contains numerous examples and descriptions of patterns and outliers and explains how to show themVisualize This demonstrates how to explain data visually so that you can present your information in a way that is easy to understand and appealing.From the Author: Telling Stories with Data Author Nathan Yau A common mistake in data design is to approach a project with a visual layout before looking at your data. This leads to graphics that lack context and provide little value. Visualize This teaches you a data-first approach. Explore what your data has to say first, and you can design graphics that mean something.Visualization and data design all come easier with practice, and you can advance your skills with every new dataset and project. To begin though, you need a proper foundation and know what tools are available to you (but not let them bog you down). I wrote Visualize This with that in mind. You'll be exposed to a variety of software and code and jump right into real-world datasets so that you can learn visualization by doing, and most importantly be able to apply what you learn to your own data.
Three Data Visualization Steps:
- Ask a Question(Click Graphic to See Larger Version) When you get a dataset, it sometimes is a challenge figuring out where to start, especially when it's a large dataset. Approach your data with a simple curiosity or a question that you want answered, and go from there.
- Explore Your Data(Click Graphic to See Larger Version) A simple curiosity often leads to more questions, which are a good guide for what stories to dig into. What variables are related to each other? Can you see changes over time? Are there any features in the data that stand out? Find out all you can about your data, because the more you know what's behind the numbers, the better story you can tell.
- Visualize Your Data(Click Graphic to See Larger Version)
Once you know the important parts of your data, you can design graphics the best way you see fit. Use shapes, colors, and sizes that make sense and help tell your story clearly to readers. While the base of your charts and graphs will share many of the same properties – bars, slices, dots, and lines – the final design elements will and should vary by your unique dataset. "
The Big Book of Dashboards: Visualizing Your Data Using Real-World Business Scenarios
1st Edition
1st Edition

The Big Book of Dashboards presents a comprehensive reference for those tasked with building or overseeing the development of business dashboards.
Comprising dozens of examples that address different industries and departments (healthcare, transportation, finance, human resources, marketing, customer service, sports, etc.) and different platforms (print, desktop, tablet, smartphone, and conference room display) The Big Book of Dashboards is the only book that matches great dashboards with real-world business scenarios.
By organizing the book based on these scenarios and offering practical and effective visualization examples, The Big Book of Dashboards will be the trusted resource that you open when you need to build an effective business dashboard.
In addition to the scenarios there's an entire section of the book that is devoted to addressing many practical and psychological factors you will encounter in your work. It's great to have theory and evidenced-based research at your disposal, but what will you do when somebody asks you to make your dashboard 'cooler' by adding packed bubbles and donut charts?
The expert authors have a combined 30-plus years of hands-on experience helping people in hundreds of organizations build effective visualizations. They have fought many 'best practices' battles and having endured bring an uncommon empathy to help you, the reader of this book, survive and thrive in the data visualization world.
A well-designed dashboard can point out risks, opportunities, and more; but common challenges and misconceptions can make your dashboard useless at best, and misleading at worst. The Big Book of Dashboards gives you the tools, guidance, and models you need to produce great dashboards that inform, enlighten, and engage."
Data Points: Visualization That Means Something
1st Edition
1st Edition
Whether it's statistical charts, geographic maps, or the snappy graphical statistics you see on your favorite news sites, the art of data graphics or visualization is fast becoming a movement of its own. In Data Points: Visualization That Means Something, author Nathan Yau presents an intriguing complement to his bestseller Visualize This, this time focusing on the graphics side of data analysis. Using examples from art, design, business, statistics, cartography, and online media, he explores both standard-and not so standard-concepts and ideas about illustrating data.
- Shares intriguing ideas from Nathan Yau, author of Visualize This and creator of flowingdata.com, with over 66,000 subscribers
- Focuses on visualization, data graphics that help viewers see trends and patterns they might not otherwise see in a table
- Includes examples from the author's own illustrations, as well as from professionals in statistics, art, design, business, computer science, cartography, and more
- Examines standard rules across all visualization applications, then explores when and where you can break those rules
- Create visualizations that register at all levels, with Data Points: Visualization That Means Something.
Rapid Graphs with Tableau Software 8: The Original Guide for the Accidental Analyst
Paperback – April 26, 2013
Paperback – April 26, 2013
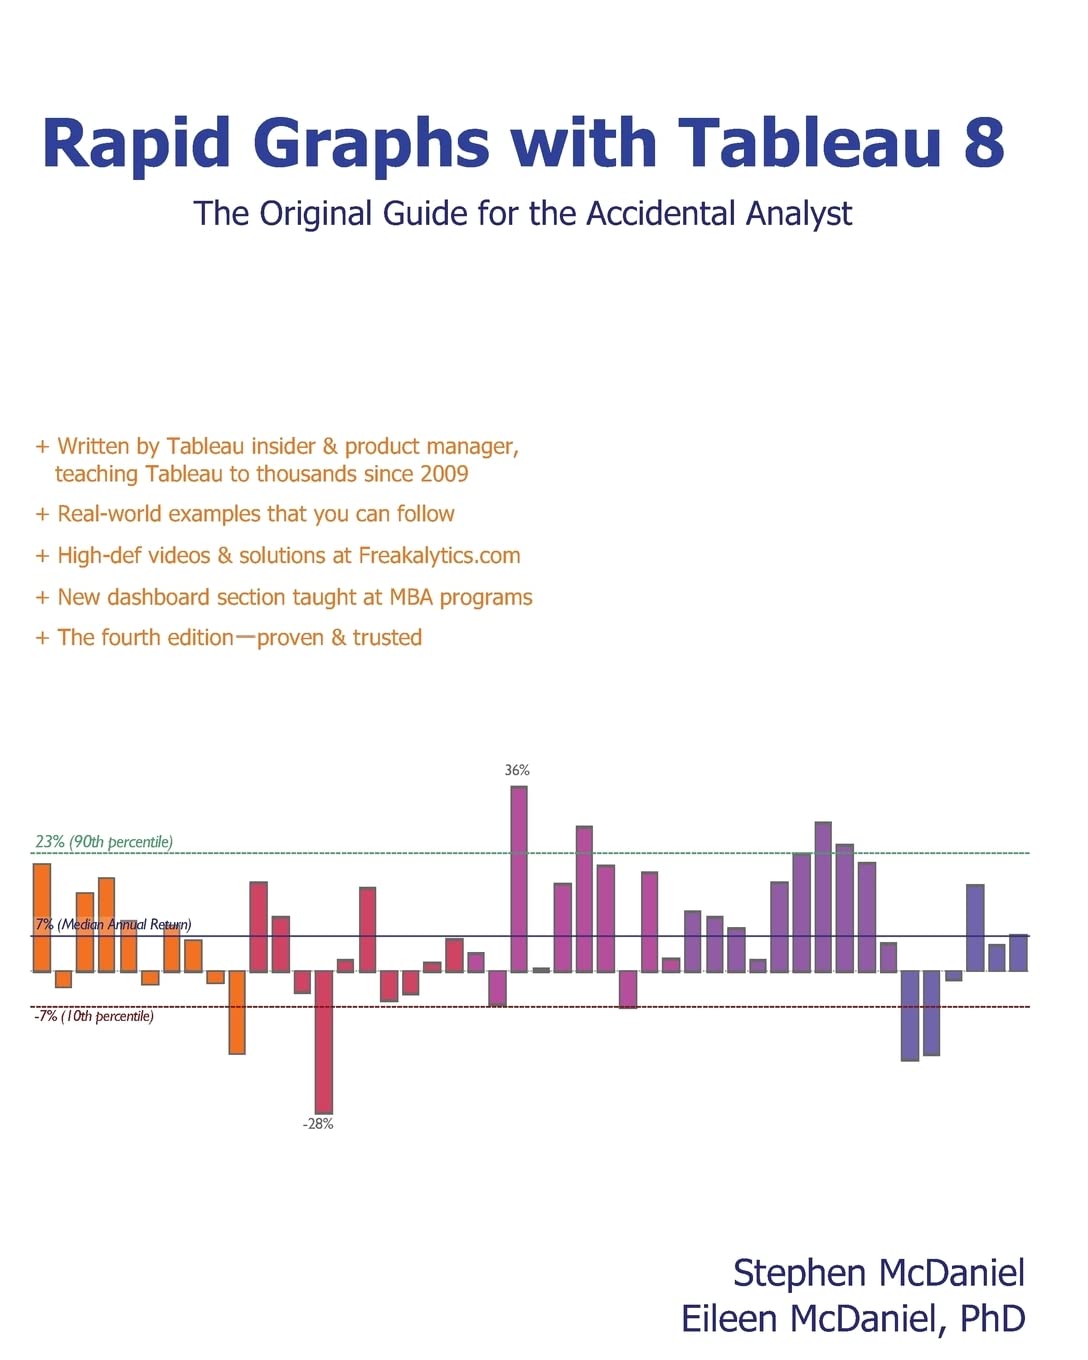
The 8 version of this book is now published by Apress in grayscale in print and in color via ebooks.
- Written by Tableau insider & product manager, teaching Tableau to thousands since 2009
- Real-world examples that you can follow
- High-def videos & solutions at freakalytics.com
- The fourth edition-proven & trusted
Tired of boring spreadsheets and data overload from confusing graphs? Master the art of rapid graphs with Tableau! Our hands-on case study approach and more than 225 illustrations teach you how to quickly explore and understand your data to make informed decisions in a wide variety of real-world situations. We include best practices of visual analytics for ideas on how to communicate your findings with audience-friendly graphs, tables and maps.
""A picture is worth a thousand words"" is a common saying that is more relevant today than ever as data volumes grow and the need for easy access to answers becomes more critical. This book covers the core of Tableau capabilities in easy-to-follow examples, updated and expanded for Version 8, as the fourth edition of the first book on Tableau. Learn how to be successful with Tableau from the team that started the original training program as the founding Tableau Education Partner!
""A must read for anyone interested in Tableau. Clear explanations, practical advice and beautiful examples!""
Elissa Fink – Chief Marketing Officer, Tableau Software
""A great work- this is going to be a much-loved book.""
Marc Rueter – Senior Director of Technology, Consulting and Strategy, Tableau Software
""Well written, easy to use book that has something for everyone. A great resource if you are new to Tableau… but also useful tips for advanced users as well.""
Bob Morrison – Founder/CEO, Quadrant Arts Education Research and Chairman at MakeMusic
Stephen McDaniel
Stephen is passionate about helping people understand, present and take action with their data. He is author of SAS for Dummies, The AccidentalAnalyst and the Rapid Dashboard Reference Card. He has been on the Faculty of The American Marketing Association and The Data Warehouse Institute and is currently Director of Analytics at Tableau Software and Principal Analyst at Freakalytics, LLC.
Eileen McDaniel
Co-founder of Freakalytics, Eileen directs the development of books and course materials. She is lead author of The Accidental Analyst: Show Your Data Who's Boss. This book provides a step-by-step analysis framework to help people who didn’t plan for a career as an analyst, but now must analyze data quickly and effectively.
Visit www.Freakalytics.com for information on analyst and Tableau training seminars."
Tableau: Creating Interactive Data Visualizations
Kindle Edition
Kindle Edition
Illustrate your data in a more interactive way by implementing data visualization principles and creating visual stories using Tableau
About This Book
- Use data visualization principles to help you to design dashboards that enlighten and support business decisions
- Integrate your data to provide mashed-up dashboards
- Connect to various data sources and understand what data is appropriate for Tableau Public
- Understand chart types and when to use specific chart types with different types of data
Who This Book Is For
Data scientists who have just started using Tableau and want to build on the skills using practical examples. Familiarity with previous versions of Tableau will be helpful, but not necessary.
What You Will Learn
- Customize your designs to meet the needs of your business using Tableau
- Use Tableau to prototype, develop, and deploy the final dashboard
- Create filled maps and use any shape file
- Discover features of Tableau Public, from basic to advanced
- Build geographic maps to bring context to data
- Create filters and actions to allow greater interactivity to Tableau Public visualizations and dashboards
- Publish and embed Tableau visualizations and dashboards in articles
In Detail
With increasing interest for data visualization in the media, businesses are looking to create effective dashboards that engage as well as communicate the truth of data. Tableau makes data accessible to everyone, and is a great way of sharing enterprise dashboards across the business. Tableau is a revolutionary toolkit that lets you simply and effectively create high-quality data visualizations.
This course starts with making you familiar with its features and enable you to develop and enhance your dashboard skills, starting with an overview of what dashboard is, followed by how you can collect data using various mathematical formulas. Next, you'll learn to filter and group data, as well as how to use various functions to present the data in an appealing and accurate way.
In the first module, you will learn how to use the key advanced string functions to play with data and images. You will be walked through the various features of Tableau including dual axes, scatterplot matrices, heat maps, and sizing.In the second module, you'll start with getting your data into Tableau, move onto generating progressively complex graphics, and end with the finishing touches and packaging your work for distribution. This module is filled with practical examples to help you create filled maps, use custom markers, add slider selectors, and create dashboards. You will learn how to manipulate data in various ways by applying various filters, logic, and calculating various aggregate measures. Finally, in the third module, you learn about Tableau Public using which allows readers to explore data associations in multiple-sourced public data, and uses state-of-the-art dashboard and chart graphics to immerse the users in an interactive experience. In this module, the readers can quickly gain confidence in understanding and expanding their visualization, creation knowledge, and quickly create interesting, interactive data visualizations to bring a richness and vibrancy to complex articles.
The course provides a great overview for beginner to intermediate Tableau users, and covers the creation of data visualizations of varying complexities.
Style and approach
The approach will be a combined perspective, wherein we start by performing some basic recipes and move on to some advanced ones. Finally, we perform some advanced analytics and create appealing and insightful data stories using Tableau Public in a step-by-step manner."
Veracity of Big Data: Machine Learning and Other Approaches to Verifying Truthfulness
1st ed. Edition, Kindle Edition
1st ed. Edition, Kindle Edition
You will learn the four V’s of big data, including veracity, and study the problem from various angles. The solutions discussed are drawn from diverse areas of engineering and math, including machine learning, statistics, formal methods, and the Blockchain technology.
Veracity of Big Data serves as an introduction to machine learning algorithms and diverse techniques such as the Kalman filter, SPRT, CUSUM, fuzzy logic, and Blockchain, showing how they can be used to solve problems in the veracity domain. Using examples, the math behind the techniques is explained in easy-to-understand language.
Determining the truth of big data in real-world applications involves using various tools to analyze the available information. This book delves into some of the techniques that can be used. Microblogging websites such as Twitter have played a major role in public life, including during presidential elections. The book uses examples of microblogs posted on a particular topic to demonstrate how veracity can be examined and established. Some of the techniques are described in the context of detecting veiled attacks on microblogging websites to influence public opinion.
What You'll Learn
- Understand the problem concerning data veracity and its ramifications
- Develop the mathematical foundation needed to help minimize the impact of the problem using easy-to-understand language and examples
- Use diverse tools and techniques such as machine learning algorithms, Blockchain, and the Kalman filter to address veracity issues
Who This Book Is For
Software developers and practitioners, practicing engineers, curious managers, graduate students, and research scholars"
The Big Book of Dashboards: Visualizing Your Data Using Real-World Business Scenarios
The Big Book of Dashboards presents a comprehensive reference for those tasked with building or overseeing the development of business dashboards.
Comprising dozens of examples that address different industries and departments (healthcare, transportation, finance, human resources, marketing, customer service, sports, etc.) and different platforms (print, desktop, tablet, smartphone, and conference room display) The Big Book of Dashboards is the only book that matches great dashboards with real-world business scenarios.
By organizing the book based on these scenarios and offering practical and effective visualization examples, The Big Book of Dashboards will be the trusted resource that you open when you need to build an effective business dashboard.
In addition to the scenarios there's an entire section of the book that is devoted to addressing many practical and psychological factors you will encounter in your work. It's great to have theory and evidenced-based research at your disposal, but what will you do when somebody asks you to make your dashboard 'cooler' by adding packed bubbles and donut charts?
The expert authors have a combined 30-plus years of hands-on experience helping people in hundreds of organizations build effective visualizations. They have fought many 'best practices' battles and having endured bring an uncommon empathy to help you, the reader of this book, survive and thrive in the data visualization world.
A well-designed dashboard can point out risks, opportunities, and more; but common challenges and misconceptions can make your dashboard useless at best, and misleading at worst. The Big Book of Dashboards gives you the tools, guidance, and models you need to produce great dashboards that inform, enlighten, and engage."
Information Dashboard Design: The Effective Visual Communication of Data
1st Edition
1st Edition
Dashboards have become popular in recent years as uniquely powerful tools for communicating important information at a glance. Although dashboards are potentially powerful, this potential is rarely realized. The greatest display technology in the world won't solve this if you fail to use effective visual design. And if a dashboard fails to tell you precisely what you need to know in an instant, you'll never use it, even if it's filled with cute gauges, meters, and traffic lights. Don't let your investment in dashboard technology go to waste.
This book will teach you the visual design skills you need to create dashboards that communicate clearly, rapidly, and compellingly. Information Dashboard Design will explain how to:
- Avoid the thirteen mistakes common to dashboard design
- Provide viewers with the information they need quickly and clearly
- Apply what we now know about visual perception to the visual presentation of information
- Minimize distractions, cliches, and unnecessary embellishments that create confusion
- Organize business information to support meaning and usability
- Create an aesthetically pleasing viewing experience
- Maintain consistency of design to provide accurate interpretation
- Optimize the power of dashboard technology by pairing it with visual effectiveness
Stephen Few has over 20 years of experience as an IT innovator, consultant, and educator. As Principal of the consultancy Perceptual Edge, Stephen focuses on data visualization for analyzing and communicating quantitative business information. He provides consulting and training services, speaks frequently at conferences, and teaches in the MBA program at the University of California in Berkeley. He is also the author of Show Me the Numbers: Designing Tables and Graphs to Enlighten."
Data Points: Visualization That Means Something
1st Edition
1st Edition

Whether it's statistical charts, geographic maps, or the snappy graphical statistics you see on your favorite news sites, the art of data graphics or visualization is fast becoming a movement of its own. In Data Points: Visualization That Means Something, author Nathan Yau presents an intriguing complement to his bestseller Visualize This, this time focusing on the graphics side of data analysis. Using examples from art, design, business, statistics, cartography, and online media, he explores both standard-and not so standard-concepts and ideas about illustrating data.
Shares intriguing ideas from Nathan Yau, author of Visualize This and creator of flowingdata.com, with over 66,000 subscribers
Focuses on visualization, data graphics that help viewers see trends and patterns they might not otherwise see in a table
Includes examples from the author's own illustrations, as well as from professionals in statistics, art, design, business, computer science, cartography, and more
Examines standard rules across all visualization applications, then explores when and where you can break those rules
Create visualizations that register at all levels, with Data Points: Visualization That Means Something.
Storytelling with Data: A Data Visualization Guide for Business Professionals
1st Edition
1st Edition
Don't simply show your data—tell a story with it! Storytelling with Data teaches you the fundamentals of data visualization and how to communicate effectively with data. You'll discover the power of storytelling and the way to make data a pivotal point in your story. The lessons in this illuminative text are grounded in theory, but made accessible through numerous real-world examples—ready for immediate application to your next graph or presentation.
Storytelling is not an inherent skill, especially when it comes to data visualization, and the tools at our disposal don't make it any easier. This book demonstrates how to go beyond conventional tools to reach the root of your data, and how to use your data to create an engaging, informative, compelling story. Specifically, you'll learn how to:
- Understand the importance of context and audience
- Determine the appropriate type of graph for your situation
- Recognize and eliminate the clutter clouding your information
- Direct your audience's attention to the most important parts of your data
- Think like a designer and utilize concepts of design in data visualization
- Leverage the power of storytelling to help your message resonate with your audience
Together, the lessons in this book will help you turn your data into high impact visual stories that stick with your audience. Rid your world of ineffective graphs, one exploding 3D pie chart at a time. There is a story in your data—Storytelling with Data will give you the skills and power to tell it."
Data Visualization Guide: Clear Introduction to Data Mining, Analysis, and Visualization
Kindle Edition
Kindle Edition
Have you ever wondered how you can work with large volumes of data sets? Do you ever think about how you can use these data sets to identify hidden patterns and make an informed decision? Do you know where you can collect this information? Have you ever questioned what you can do with incomplete or incorrect data sets? If you said yes to any of these questions, then you have come to the right place.Most businesses collect information from various sources. This information can be in different formats and needs to be collected, processed, and improved upon if you want to interpret it. You can use various data mining tools to source the information from different places. These tools can also help with the cleaning and processing techniques.You can use this information to make informed decisions and improve the efficiency and methods in your business. Every business needs to find a way to interpret and analyze large data sets. To do this, you will need to learn more about the different libraries and functions used to improve data sets. Since most data professionals use Python as the base programming language to develop models, this book uses some common libraries and functions from Python to give you a brief introduction to the language.If you are a budding analyst or want to freshen up on your concepts, this book is for you. It has all the basic information you need to help you become a data analyst or scientist.In this book, you will:
- Learn what data mining is, and how you can apply in different fields.
- Discover the different components in data mining architecture.
- Investigate the different tools used for data mining.
- Uncover what data analysis is and why it’s important.
- Understand how to prepare for data analysis.
- Visualize the data.
- And so much more!
So, what are you waiting for? Grab a copy of this book now."
Data Lake / Data Warehouse
Data Lake Architecture: Designing the Data Lake and Avoiding the Garbage Dump
Organizations invest incredible amounts of time and money in obtaining and then storing big data in stores called data lakes. But how many of these organizations can actually get the data back out in a useable form? Very few can turn a data lake into an information gold mine. Most wind up with garbage dumps.
Data Lake Architecture will explain how to build a useful data lake where data scientists and data analysts can solve business challenges and identify new business opportunities. Learn how to structure data lakes as well as analog, application, and text-based data ponds to provide maximum business value. Understand the role of the raw data pond and when to use an archival data pond. Leverage the four key ingredients for data lake success: metadata, integration mapping, context, and metaprocess.
Bill Inmon opened our eyes to the architecture and benefits of a data warehouse, and now he takes us to the next level of data lake architecture.
Data Lake for Enterprises: Lambda Architecture for building enterprise data systems
Kindle Edition
Kindle Edition
A practical guide to implementing your enterprise data lake using Lambda Architecture as the base
Key Features
- Build a full-fledged data lake for your organization with popular big data technologies using the Lambda architecture as the base
- Delve into the big data technologies required to meet modern day business strategies
- A highly practical guide to implementing enterprise data lakes with lots of examples and real-world use-cases
Book Description
The term ""Data Lake"" has recently emerged as a prominent term in the big data industry. Data scientists can make use of it in deriving meaningful insights that can be used by businesses to redefine or transform the way they operate. Lambda architecture is also emerging as one of the very eminent patterns in the big data landscape, as it not only helps to derive useful information from historical data but also correlates real-time data to enable business to take critical decisions. This book tries to bring these two important aspects – data lake and lambda architecture-together.
This book is divided into three main sections. The first introduces you to the concept of data lakes, the importance of data lakes in enterprises, and getting you up-to-speed with the Lambda architecture. The second section delves into the principal components of building a data lake using the Lambda architecture. It introduces you to popular big data technologies such as Apache Hadoop, Spark, Sqoop, Flume, and ElasticSearch. The third section is a highly practical demonstration of putting it all together, and shows you how an enterprise data lake can be implemented, along with several real-world use-cases. It also shows you how other peripheral components can be added to the lake to make it more efficient.
By the end of this book, you will be able to choose the right big data technologies using the lambda architectural patterns to build your enterprise data lake.
What You Will Learn
- Build an enterprise-level data lake using the relevant big data technologies
- Understand the core of the Lambda architecture and how to apply it in an enterprise
- Learn the technical details around Sqoop and its functionalities
- Integrate Kafka with Hadoop components to acquire enterprise data
- Use flume with streaming technologies for stream-based processing
- Understand stream- based processing with reference to Apache Spark Streaming
- Incorporate Hadoop components and know the advantages they provide for enterprise data lakes
- Build fast, streaming, and high-performance applications using ElasticSearch
- Make your data ingestion process consistent across various data formats with configurability
- Process your data to derive intelligence using machine learning algorithms
Who This Book Is For
Java developers and architects who would like to implement a data lake for their enterprise will find this book useful. If you want to get hands-on experience with the Lambda Architecture and big data technologies by implementing a practical solution using these technologies, this book will also help you.
Table of Contents
- Introduction to Data
- Comprehensive Concepts of a Data Lake
- Lambda Architecture as a Pattern for Data Lake
- Applied Lambda for Data Lake
- Data Acquisition of Batch Data using Apache Sqoop
- Data Acquisition of Stream Data using Apache Flume
- Messaging Layer using Apache Kafka
- Data Processing using Apache Flink
- Data Store Using Apache Hadoop
- Indexed Data Store using Elasticsearch
- Data Lake Components Working Together
- Data Lake Use Case Suggestions
Azure Synapse Analytics Cookbook: Implement a limitless analytical platform using effective recipes for Azure Synapse
Whether you’re an Azure veteran or just getting started, get the most out of your data with effective recipes for Azure Synapse
Key Features
- Discover new techniques for using Azure Synapse, regardless of your level of expertise
- Integrate Azure Synapse with other data sources to create a unified experience for your analytical needs using Microsoft Azure
- Learn how to embed data governance and classification with Synapse Analytics by integrating Azure Purview
Book Description
As data warehouse management becomes increasingly integral to successful organizations, choosing and running the right solution is more important than ever. Microsoft Azure Synapse is an enterprise-grade, cloud-based data warehousing platform, and this book holds the key to using Synapse to its full potential. If you want the skills and confidence to create a robust enterprise analytical platform, this cookbook is a great place to start.
You'll learn and execute enterprise-level deployments on medium-to-large data platforms. Using the step-by-step recipes and accompanying theory covered in this book, you'll understand how to integrate various services with Synapse to make it a robust solution for all your data needs. Whether you're new to Azure Synapse or just getting started, you'll find the instructions you need to solve any problem you may face, including using Azure services for data visualization as well as for artificial intelligence (AI) and machine learning (ML) solutions.
By the end of this Azure book, you'll have the skills you need to implement an enterprise-grade analytical platform, enabling your organization to explore and manage heterogeneous data workloads and employ various data integration services to solve real-time industry problems.
What you will learn
- Discover the optimal approach for loading and managing data
- Work with notebooks for various tasks, including ML
- Run real-time analytics using Azure Synapse Link for Cosmos DB
- Perform exploratory data analytics using Apache Spark
- Read and write DataFrames into Parquet files using PySpark
- Create reports on various metrics for monitoring key KPIs
- Combine Power BI and Serverless for distributed analysis
- Enhance your Synapse analysis with data visualizations
Who this book is for
This book is for data architects, data engineers, and developers who want to learn and understand the main concepts of Azure Synapse analytics and implement them in real-world scenarios.
Table of Contents
- Choosing the Optimal Method for Loading Data to Synapse
- Creating Robust Data Pipelines and Data Transformation
- Processing Data Optimally across Multiple Nodes
- Engineering Real-time Analytics with Azure Synapse Link Using Cosmos DB
- Data Transformation and Processing with Synapse Notebooks
- Enriching Data Using the Azure ML AutoML Regression Model
- Visualizing and Reporting Petabytes of Data
- Data Cataloging and Governance
- MPP Platform Migration to Synapse
Google BigQuery: The Definitive Guide: Data Warehousing, Analytics, and Machine Learning at Scale
1st Edition
1st Edition
Work with petabyte-scale datasets while building a collaborative, agile workplace in the process. This practical book is the canonical reference to Google BigQuery, the query engine that lets you conduct interactive analysis of large datasets. BigQuery enables enterprises to efficiently store, query, ingest, and learn from their data in a convenient framework. With this book, you’ll examine how to analyze data at scale to derive insights from large datasets efficiently.
Valliappa Lakshmanan, tech lead for Google Cloud Platform, and Jordan Tigani, engineering director for the BigQuery team, provide best practices for modern data warehousing within an autoscaled, serverless public cloud. Whether you want to explore parts of BigQuery you’re not familiar with or prefer to focus on specific tasks, this reference is indispensable.
Learning Google BigQuery: A beginner’s guide to mining massive datasets through interactive analysis
Get a fundamental understanding of how Google BigQuery works by analyzing and querying large datasets
Key Features
- Get started with BigQuery API and write custom applications using it
- Learn how BigQuery API can be used for storing, managing, and querying massive datasets
- Learn everything you need to know about Google BigQuery
Book Description
Google BigQuery is a popular cloud data warehouse for large-scale data analytics. Learning Google BigQuery will serve as a comprehensive guide to mastering BigQuery, and how you can utilize it to quickly and efficiently get useful insights from on Big Data.
You will begin with getting a quick overview of the Google Cloud Platform and the various services it supports. Then, you will be introduced to the Google BigQuery API and how it fits within in the framework of GCP. The book covers useful techniques to migrate your existing data from your enterprise to Google BigQuery, as well as readying and optimizing it for analysis. You will perform basic as well as advanced data querying using BigQuery, and connect the results to various third-party tools for reporting and visualization purposes such as R and Tableau. If you're looking to implement real-time reporting of your streaming data running in your enterprise, this book will also help you.
In the final chapters, you’ll explore tips, best practices, as well as mistakes to avoid while working with Google BigQuery and services that interact with it. By the time you're done with it, you will have set a solid foundation in working with BigQuery to solve even the trickiest of data problems.
What you will learn
- Get a hands-on introduction to Google Cloud Platform and its services
- Understand the different data types supported by Google BigQuery
- Migrate your enterprise data to BigQuery and query it using SQL techniques
- Use partition tables in your project and query external data sources and wild card tables
- Create tables and datasets dynamically using the BigQuery API
- Insert records for analytics using Python and C#
- Visualize your BigQuery data by connecting it to third-party tools such as Tableau and R
- Master the Google Cloud Pub/Sub to implement real-time reporting and analytics of your Big Data
Who This Book Is For
Learning Google BigQuery is for developers, data analysts, and data scientists looking to run complex queries over thousands of records in seconds. No prior experience of working with BigQuery is assumed.
Table of Contents
- Google Cloud and Google BigQuery
- Google Cloud SDK
- Google BigQuery Data Types
- BigQuery SQL Basic
- BigQuery SQL Advanced
- BigQuery API
- Visualizing BigQuery Data
- Google Cloud Pub Sub
Data Mesh: Delivering Data-Driven Value at Scale
1st Edition
1st Edition
We're at an inflection point in data, where our data management solutions no longer match the complexity of organizations, the proliferation of data sources, and the scope of our aspirations to get value from data with AI and analytics. In this practical book, author Zhamak Dehghani introduces data mesh, a decentralized sociotechnical paradigm drawn from modern distributed architecture that provides a new approach to sourcing, sharing, accessing, and managing analytical data at scale.
Dehghani guides practitioners, architects, technical leaders, and decision makers on their journey from traditional big data architecture to a distributed and multidimensional approach to analytical data management. Data mesh treats data as a product, considers domains as a primary concern, applies platform thinking to create self-serve data infrastructure, and introduces a federated computational model of data governance.
- Get a complete introduction to data mesh principles and its constituents
- Design a data mesh architecture
- Guide a data mesh strategy and execution
- Navigate organizational design to a decentralized data ownership model
- Move beyond traditional data warehouses and lakes to a distributed data mesh
The Data Warehouse Toolkit: The Definitive Guide to Dimensional Modeling
3rd Edition
3rd Edition
Updated new edition of Ralph Kimball’s groundbreaking book on dimensional modeling for data warehousing and business intelligence!
The first edition of Ralph Kimball's The Data Warehouse Toolkit introduced the industry to dimensional modeling,and now his books are considered the most authoritative guides in this space. This new third edition is a complete library of updated dimensional modeling techniques, the most comprehensive collection ever. It covers new and enhanced star schema dimensional modeling patterns, adds two new chapters on ETL techniques, includes new and expanded business matrices for 12 case studies, and more.
- Authored by Ralph Kimball and Margy Ross, known worldwide as educators, consultants, and influential thought leaders in data warehousing and business intelligence
- Begins with fundamental design recommendations and progresses through increasingly complex scenarios
- Presents unique modeling techniques for business applications such as inventory management, procurement, invoicing, accounting,customer relationship management, big data analytics, and more
- Draws real-world case studies from a variety of industries,including retail sales, financial services, telecommunications,education, health care, insurance, e-commerce, and more
- Design dimensional databases that are easy to understand and provide fast query response with The Data Warehouse Toolkit: The Definitive Guide to Dimensional Modeling, 3rd Edition.
Building a Data Warehouse: With Examples in SQL Server (Expert’s Voice)
1st ed. Edition
1st ed. Edition
Updated new edition of Ralph Kimball’s groundbreaking book on dimensional modeling for data warehousing and business intelligence!
Here is the ideal field guide for data warehousing implementation. This book first teaches you how to build a data warehouse, including defining the architecture, understanding the methodology, gathering the requirements, designing the data models, and creating the databases. Coverage then explains how to populate the data warehouse and explores how to present data to users using reports and multidimensional databases and how to use the data in the data warehouse for business intelligence, customer relationship management, and other purposes. It also details testing and how to administer data warehouse operation.
The Data Warehouse ETL Toolkit: Practical Techniques for Extracting, Cleaning, Conforming, and Delivering Data
1st Edition
1st Edition
Updated new edition of Ralph Kimball’s groundbreaking book on dimensional modeling for data warehousing and business intelligence!
Cowritten by Ralph Kimball, the world's leading data warehousing authority, whose previous books have sold more than 150,000 copies
Delivers real-world solutions for the most time- and labor-intensive portion of data warehousing-data staging, or the extract, transform, load (ETL) process
Delineates best practices for extracting data from scattered sources, removing redundant and inaccurate data, transforming the remaining data into correctly formatted data structures, and then loading the end product into the data warehouse
Offers proven time-saving ETL techniques, comprehensive guidance on building dimensional structures, and crucial advice on ensuring data quality
The Data Warehouse Lifecycle Toolkit : Expert Methods for Designing, Developing, and Deploying Data Warehouses
"""A comprehensive, thoughtful, and detailed book that will be of inestimable value to anyone struggling with the complex details of designing, building, and maintaining an enterprise-wide decision support system. Highly recommended."" -Robert S. Craig, Vice President, Application Architectures, Hurwitz Group, Inc.
In his bestselling book, The Data Warehouse Toolkit, Ralph Kimball showed you how to use dimensional modeling to design effective and usable data warehouses. Now, he carries these techniques to the larger issues of delivering complete data marts and data warehouses. Drawing upon their experiences with numerous data warehouse implementations, he and his coauthors show you all the practical details involved in planning, designing, developing, deploying, and growing data warehouses. Important topics include:
- The Business Dimensional Lifecycle(TM) approach to data warehouse project planning and management
- Techniques for gathering requirements more effectively and efficiently
- Advanced dimensional modeling techniques to capture the most complex business rules
- The Data Warehouse Bus Architecture and other approaches for integrating data marts into super-flexible data warehouses
- A framework for creating your technical architecture
- Techniques for minimizing the risks involved with data staging
- Aggregations and other effective ways to boost data warehouse performance
- Cutting-edge, Internet-based data warehouse security techniques
The CD-ROM supplies you with:
- Complete data warehouse project plan tasks and responsibilities
- A set of sample models that demonstrate the Bus Architecture
- Blank versions of the templates and tools described in the book
- Checklists to use at key points in the project"
The Data Warehouse Toolkit: The Definitive Guide to Dimensional Modeling
3rd Edition
3rd Edition

Updated new edition of Ralph Kimball's groundbreaking book on dimensional modeling for data warehousing and business intelligence!
The first edition of Ralph Kimball's The Data Warehouse Toolkit introduced the industry to dimensional modeling,and now his books are considered the most authoritative guides in this space. This new third edition is a complete library of updated dimensional modeling techniques, the most comprehensive collection ever. It covers new and enhanced star schema dimensional modeling patterns, adds two new chapters on ETL techniques, includes new and expanded business matrices for 12 case studies, and more.
Authored by Ralph Kimball and Margy Ross, known worldwide as educators, consultants, and influential thought leaders in data warehousing and business intelligence
Begins with fundamental design recommendations and progresses through increasingly complex scenarios
Presents unique modeling techniques for business applications such as inventory management, procurement, invoicing, accounting,customer relationship management, big data analytics, and more
Draws real-world case studies from a variety of industries,including retail sales, financial services, telecommunications,education, health care, insurance, e-commerce, and more
Design dimensional databases that are easy to understand and provide fast query response with The Data Warehouse Toolkit: The Definitive Guide to Dimensional Modeling, 3rd Edition.
Advanced Algorithms and Data Structures
Audible Audiobook – Unabridged
Audible Audiobook – Unabridged
As a software engineer, you’ll encounter countless programming challenges that initially seem confusing, difficult, or even impossible. Don’t despair! Many of these “new” problems already have well-established solutions. Advanced Algorithms and Data Structures teaches you powerful approaches to a wide range of tricky coding challenges that you can adapt and apply to your own applications. Providing a balanced blend of classic, advanced, and new algorithms, this practical guide upgrades your programming toolbox with new perspectives and hands-on techniques.
About the technology
Can you improve the speed and efficiency of your applications without investing in new hardware? Well, yes, you can: Innovations in algorithms and data structures have led to huge advances in application performance. Pick up this book to discover a collection of advanced algorithms that will make you a more effective developer.
About the book
Advanced Algorithms and Data Structures introduces a collection of algorithms for complex programming challenges in data analysis, machine learning, and graph computing. You’ll discover cutting-edge approaches to a variety of tricky scenarios. You’ll even learn to design your own data structures for projects that require a custom solution.
What's inside
- Build on basic data structures you already know
- Profile your algorithms to speed up application
- Store and query strings efficiently
- Distribute clustering algorithms with Map Reduce
- Solve logistics problems using graphs and optimization algorithms
About the audience
- For intermediate programmers.
About the author
Marcello La Rocca is a research scientist and a full-stack engineer. His focus is on optimization algorithms, genetic algorithms, machine learning, and quantum computing.
PLEASE NOTE: When you purchase this title, the accompanying PDF will be available in your Audible Library along with the audio.
Hands-On SQL Server 2019 Analysis Services: Design and query tabular and multi-dimensional models using Microsoft’s SQL Server Analysis Services
Get up to speed with the new features added to Microsoft SQL Server 2019 Analysis Services and create models to support your business
Key Features
- Explore tips and tricks to design, develop, and optimize end-to-end data analytics solutions using Microsoft's technologies
- Learn tabular modeling and multi-dimensional cube design development using real-world examples
- Implement Analysis Services to help you make productive business decisions
Book Description
SQL Server Analysis Services (SSAS) continues to be a leading enterprise-scale toolset, enabling customers to deliver data and analytics across large datasets with great performance. This book will help you understand MS SQL Server 2019's new features and improvements, especially when it comes to SSAS.
First, you'll cover a quick overview of SQL Server 2019, learn how to choose the right analytical model to use, and understand their key differences. You'll then explore how to create a multi-dimensional model with SSAS and expand on that model with MDX. Next, you'll create and deploy a tabular model using Microsoft Visual Studio and Management Studio. You'll learn when and how to use both tabular and multi-dimensional model types, how to deploy and configure your servers to support them, and design principles that are relevant to each model. The book comes packed with tips and tricks to build measures, optimize your design, and interact with models using Excel and Power BI. All this will help you visualize data to gain useful insights and make better decisions. Finally, you'll discover practices and tools for securing and maintaining your models once they are deployed.
By the end of this MS SQL Server book, you'll be able to choose the right model and build and deploy it to support the analytical needs of your business.
What you will learn
- Determine the best analytical model using SSAS
- Cover the core aspects involved in MDX, including writing your first query
- Implement calculated tables and calculation groups (new in version 2019) in DAX
- Create and deploy tabular and multi-dimensional models on SQL 2019
- Connect and create data visualizations using Excel and Power BI
- Implement row-level and other data security methods with tabular and multi-dimensional models
- Explore essential concepts and techniques to scale, manage, and optimize your SSAS solutions
Who this book is for
This Microsoft SQL Server book is for BI professionals and data analysts who are looking for a practical guide to creating and maintaining tabular and multi-dimensional models using SQL Server 2019 Analysis Services. A basic working knowledge of BI solutions such as Power BI and database querying is required.
Table of Contents
- Analysis Services in SQL Server 2019
- Choosing the SQL Server 2019 Analytic Model for Your BI Needs
- Preparing Your Data for Multidimensional Models
- Building a Multidimensional Cube in SSAS 2019
- Adding Measures and Calculations with MDX
- Preparing Your Data for Tabular Models
- Building a Tabular Model in SSAS 2019
- Adding Measures and Calculations with DAX
- Exploring and Visualizing Your Data with Excel
- Creating Interactive Reports and Enhancing Your Models in Power BI
- Securing Your SSAS Models
- Common Administration and Maintenance Tasks
Learning SQL: Generate, Manipulate, and Retrieve Data
3rd Edition
3rd Edition
As data floods into your company, you need to put it to work right away―and SQL is the best tool for the job. With the latest edition of this introductory guide, author Alan Beaulieu helps developers get up to speed with SQL fundamentals for writing database applications, performing administrative tasks, and generating reports. You’ll find new chapters on SQL and big data, analytic functions, and working with very large databases.
Each chapter presents a self-contained lesson on a key SQL concept or technique using numerous illustrations and annotated examples. Exercises let you practice the skills you learn. Knowledge of SQL is a must for interacting with data. With Learning SQL, you’ll quickly discover how to put the power and flexibility of this language to work.
- Move quickly through SQL basics and several advanced features
- Use SQL data statements to generate, manipulate, and retrieve data
- Create database objects, such as tables, indexes, and constraints with SQL schema statements
- Learn how datasets interact with queries; understand the importance of subqueries
- Convert and manipulate data with SQL’s built-in functions and use conditional logic in data statements
SQL Cheat Sheet – Quick Reference Guide
Kindle Edition
Kindle Edition
SQL Cheat Sheet & Guide, is designed as a quick reference, goto book for the working Microsoft and MySQL user. If you are like me, you like to keep all of your reference material together and not in a hundred internet searches. This QUICK LOOK reference is intended for the working IT professional in real world scenarios without having to find what you are looking for within a sea of webpage advertising, or author’s filler material.
Print and Laminate page 1 is a cut out and print to hang on your wall, if you’d like, or even laminate it. Or you may just want to keep it on your digital reader or smart phone. The remaining pages are a quick look up for SQL syntax and code explanation.
The author, Kait Chick is a network engineer / SQL Admin for a national healthcare group, and creator of the QUICK LOOK series of I.T. and programming references.
Beginning SQL Server R Services: Analytics for Data Scientists 1st ed. Edition, Kindle Edition
Learn how to develop powerful data analytics applications quickly for SQL Server database administrators and developers. Organizations will be able to sift data and derive the business intelligence needed to drive business decisions and profit. The addition of R to SQL Server 2016 places a powerful analytical processor into an environment most developers are already comfortable with – Visual Studio. This book walks even the newest of users through the creation process of a powerful R-language tool set for use in analyzing and reporting on your data.
As a SQL Server database administrator or developer, it is sometimes difficult to stay on the bleeding edge of technology. Microsoft’s addition of R to SQL Server 2016 is sure to be a game-changer, and the language will certainly become an integral part of future releases. R is in fact widely used today in statistical and related applications, and its use is only growing. Beginning SQL Server R Services helps you jump on board this important trend by providing good examples with detailed explanations of the WHY and not just the HOW.
- Walks you through setup and installation of SQL Server R Services.
- Explains the basics of working with R Tools for Visual Studio.
- Provides a road map to successfully creating custom R code.
What You Will Learn
- Discover R’s role in the SQL Server 2016 hierarchy.
- Manage the components needed to run SQL Server R Services code.
- Run R-language analytics and queries inside the database.
- Create analytic solutions that run across multiple datasets.
- Gain in-depth knowledge of the R language itself.
- Implement custom SQL Server R Services solutions.
Who This Book Is For
Any level of database administrator or developer, but specifically it's for those developers with the need to develop powerful data analytics applications quickly. Seasoned R developers will appreciate the book for its robust learning pattern, using visual aids in combination with properties explanations and scenarios. Beginning SQL Server R Services is the perfect “new hire” gift for new database developers in any organization.
Data Science / Machine Learning
Data Analysis and Visualization Using Python: Analyze Data to Create Visualizations for BI Systems
1st ed. Edition, Kindle Edition
1st ed. Edition, Kindle Edition
Look at Python from a data science point of view and learn proven techniques for data visualization as used in making critical business decisions. Starting with an introduction to data science with Python, you will take a closer look at the Python environment and get acquainted with editors such as Jupyter Notebook and Spyder. After going through a primer on Python programming, you will grasp fundamental Python programming techniques used in data science. Moving on to data visualization, you will see how it caters to modern business needs and forms a key factor in decision-making. You will also take a look at some popular data visualization libraries in Python.
Shifting focus to data structures, you will learn the various aspects of data structures from a data science perspective. You will then work with file I/O and regular expressions in Python, followed by gathering and cleaning data. Moving on to exploring and analyzing data, you will look at advanced data structures in Python. Then, you will take a deep dive into data visualization techniques, going through a number of plotting systems in Python.
In conclusion, you will complete a detailed case study, where you’ll get a chance to revisit the concepts you’ve covered so far.
What You Will Learn
- Use Python programming techniques for data science
- Master data collections in Python
- Create engaging visualizations for BI systems
- Deploy effective strategies for gathering and cleaning data
- Integrate the Seaborn and Matplotlib plotting systems
Who This Book Is For
Developers with basic Python programming knowledge looking to adopt key strategies for data analysis and visualizations using Python.
Deep Learning with Azure: Building and Deploying Artificial Intelligence Solutions on the Microsoft AI Platform
1st ed. Edition, Kindle Edition
1st ed. Edition, Kindle Edition
Get up-to-speed with Microsoft's AI Platform. Learn to innovate and accelerate with open and powerful tools and services that bring artificial intelligence to every data scientist and developer.
Artificial Intelligence (AI) is the new normal. Innovations in deep learning algorithms and hardware are happening at a rapid pace. It is no longer a question of should I build AI into my business, but more about where do I begin and how do I get started with AI?
Written by expert data scientists at Microsoft, Deep Learning with the Microsoft AI Platform helps you with the how-to of doing deep learning on Azure and leveraging deep learning to create innovative and intelligent solutions. Benefit from guidance on where to begin your AI adventure, and learn how the cloud provides you with all the tools, infrastructure, and services you need to do AI.
What You'll Learn
- Become familiar with the tools, infrastructure, and services available for deep learning on Microsoft Azure such as Azure Machine Learning services and Batch AI
- Use pre-built AI capabilities (Computer Vision, OCR, gender, emotion, landmark detection, and more)
- Understand the common deep learning models, including convolutional neural networks (CNNs), recurrent neural networks (RNNs), generative adversarial networks (GANs) with sample code and understand how the field is evolving
- Discover the options for training and operationalizing deep learning models on Azure
Introducing Data Science: Big Data, Machine Learning, and more, using Python tools
First Edition
First Edition

Summary
Introducing Data Science teaches you how to accomplish the fundamental tasks that occupy data scientists. Using the Python language and common Python libraries, you'll experience firsthand the challenges of dealing with data at scale and gain a solid foundation in data science.
Purchase of the print book includes a free eBook in PDF, Kindle, and ePub formats from Manning Publications.
About the Technology
Many companies need developers with data science skills to work on projects ranging from social media marketing to machine learning. Discovering what you need to learn to begin a career as a data scientist can seem bewildering. This book is designed to help you get started.
About the Book
Introducing Data ScienceIntroducing Data Science explains vital data science concepts and teaches you how to accomplish the fundamental tasks that occupy data scientists. You’ll explore data visualization, graph databases, the use of NoSQL, and the data science process. You’ll use the Python language and common Python libraries as you experience firsthand the challenges of dealing with data at scale. Discover how Python allows you to gain insights from data sets so big that they need to be stored on multiple machines, or from data moving so quickly that no single machine can handle it. This book gives you hands-on experience with the most popular Python data science libraries, Scikit-learn and StatsModels. After reading this book, you’ll have the solid foundation you need to start a career in data science.
What’s Inside
- Handling large data
- Introduction to machine learning
- Using Python to work with data
- Writing data science algorithms
About the Reader
This book assumes you're comfortable reading code in Python or a similar language, such as C, Ruby, or JavaScript. No prior experience with data science is required.
About the Authors
Davy Cielen, Arno D. B. Meysman, and Mohamed Ali are the founders and managing partners of Optimately and Maiton, where they focus on developing data science projects and solutions in various sectors.
Table of Contents
- Data science in a big data world
- The data science process
- Machine learning
- Handling large data on a single computer
- First steps in big data
- Join the NoSQL movement
- The rise of graph databases
- Text mining and text analytics
- Data visualization to the end user
JavaScript and jQuery: Interactive Front-End Web Development
1st Edition
1st Edition
Expert techniques to make your websites more interactive and engaging
In JavaScript and jQuery: Interactive Front-End Development, best-selling author Jon Duckett delivers a fully illustrated guide to making your websites more interactive and your interfaces more interesting and intuitive. In the book, you’ll explore basic programming concepts that assume no prior knowledge of programming beyond an ability to create a web page using HTML & CSS.
You’ll use core elements of the JavaScript language so you can learn how to write your own scripts from scratch, as well as jQuery, which will allow you to simplify the process of writing scripts (this is introduced half-way through the book once you have a solid understanding of JavaScript).
You’ll also learn to recreate techniques you have seen on other web sites such as sliders, content filters, form validation, Ajax content updates, and much more. Each chapter:
- Breaks subjects down into bite-sized chunks with a new topic on each page
- Contains clear descriptions of syntax, each one demonstrated with illustrative code samples
- Uses diagrams and photography to explain complex concepts in a visual way
- By the end of the book, not only will you be able to use the thousands of scripts, JavaScript APIs, and jQuery plugins that are freely available on the web – and be able to customize them – you will also be able to create your own scripts from scratch.
Predictive Analytics: The Power to Predict Who Will Click, Buy, Lie, or Die
Revised and Updated Edition
Revised and Updated Edition
"""Mesmerizing & fascinating…"" —The Seattle Post-Intelligencer
""The Freakonomics of big data."" —Stein Kretsinger, founding executive of advertising.com
Award-winning | Used by over 30 universities | Translated into 9 languages
An introduction for everyone. In this rich, fascinating — surprisingly accessible — introduction, leading expert Eric Siegel reveals how predictive analytics (aka machine learning) works, and how it affects everyone every day. Rather than a “how to” for hands-on techies, the book serves lay readers and experts alike by covering new case studies and the latest state-of-the-art techniques.
Prediction is booming. It reinvents industries and runs the world. Companies, governments, law enforcement, hospitals, and universities are seizing upon the power. These institutions predict whether you're going to click, buy, lie, or die.Why? For good reason: predicting human behavior combats risk, boosts sales, fortifies healthcare, streamlines manufacturing, conquers spam, optimizes social networks, toughens crime fighting, and wins elections.How? Prediction is powered by the world's most potent, flourishing unnatural resource: data. Accumulated in large part as the by-product of routine tasks, data is the unsalted, flavorless residue deposited en masse as organizations churn away. Surprise! This heap of refuse is a gold mine. Big data embodies an extraordinary wealth of experience from which to learn.Predictive analytics (aka machine learning) unleashes the power of data. With this technology, the computer literally learns from data how to predict the future behavior of individuals. Perfect prediction is not possible, but putting odds on the future drives millions of decisions more effectively, determining whom to call, mail, investigate, incarcerate, set up on a date, or medicate.In this lucid, captivating introduction — now in its Revised and Updated edition — former Columbia University professor and Predictive Analytics World founder Eric Siegel reveals the power and perils of prediction:
- What type of mortgage risk Chase Bank predicted before the recession.
- Predicting which people will drop out of school, cancel a subscription, or get divorced before they even know it themselves.
- Why early retirement predicts a shorter life expectancy and vegetarians miss fewer flights.
- Five reasons why organizations predict death — including one health insurance company.
- How U.S. Bank and Obama for America calculated the way to most strongly persuade each individual.
- Why the NSA wants all your data: machine learning supercomputers to fight terrorism.
- How IBM's Watson computer used predictive modeling to answer questions and beat the human champs on TV's Jeopardy!
- How companies ascertain untold, private truths — how Target figures out you're pregnant and Hewlett-Packard deduces you're about to quit your job.
- How judges and parole boards rely on crime-predicting computers to decide how long convicts remain in prison.
182 examples from Airbnb, the BBC, Citibank, ConEd, Facebook, Ford, Google, the IRS, LinkedIn, match.com, MTV, Netflix, PayPal, Pfizer, Spotify, Uber, UPS, Wikipedia, and more.
How does predictive analytics work? This jam-packed book satisfies by demystifying the intriguing science under the hood. For future hands-on practitioners pursuing a career in the field, it sets a strong foundation, delivers the prerequisite knowledge, and whets your appetite for more.
A truly omnipresent science, predictive analytics constantly affects our daily lives. Whether you are a consumer of it — or consumed by it — get a handle on the power of Predictive Analytics.
Master Data Science and Data Analysis with Pandas
Kindle Edition
Kindle Edition

Pandas has became an important and a must tool for data analysis. This book covers various scenarios that occurs in real life data and thus helps reader to relate the issues directly and apply the solution. The book has been developed in such a way that everyone can easily understand and run through the concepts. This book has been created for both beginners and experienced ones as the beginners can learn the technology from scratch and experienced ones can brush their concepts and can relate their issues and understand the concept in depth.