Venue
Your conference room, or our cosy loft
Online won’t work here 🙁
Time
Info request – up to 10 days
Arrangements – up to 10 days
Facilitation session – 2 days
Processing of results – up to 10 days
Price
more expensive
than cheap
Tour group
Up to 15 people:
IT, Business and BI leaders
+ everyone who cares
You’ve got a park of systems, repositories and bi tools. Lots of people dealing with data. It seems that something is moving somewhere, but the heart isn’t at ease and you lack drive.
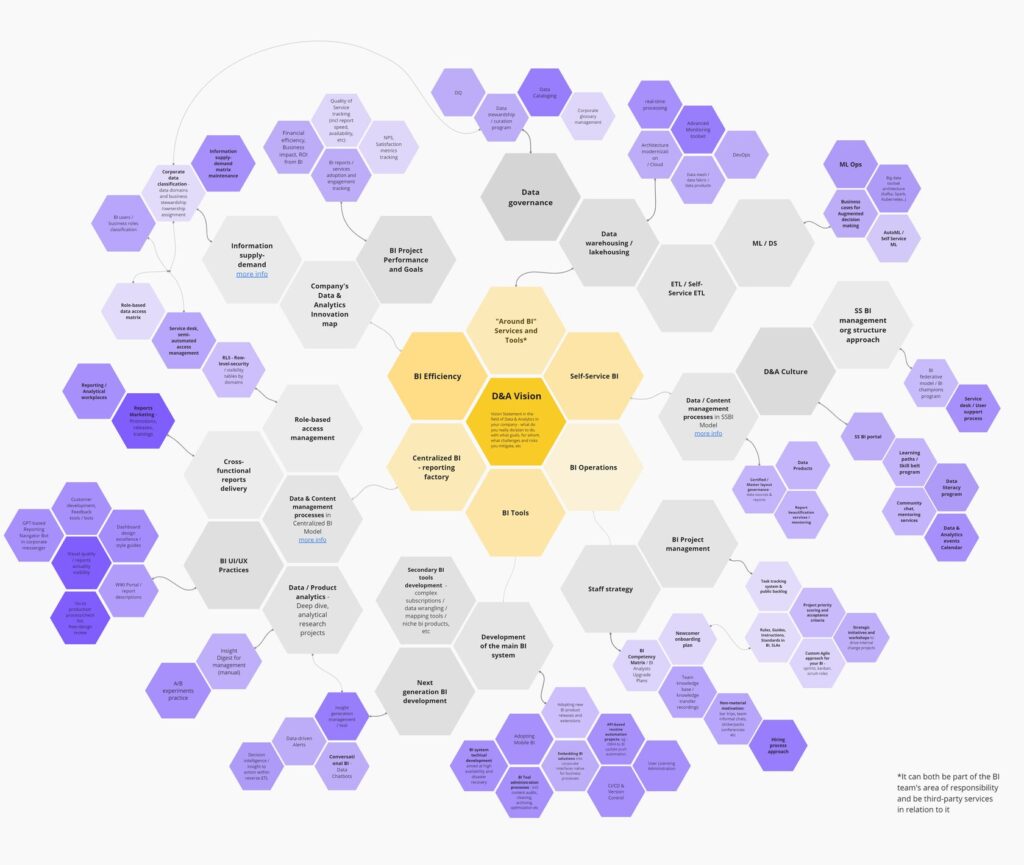
We’ve leveled up our knowledge of how a corporate BI project should look like, and we help to assemble a coherent development program from a variety of trendy practices and make it shake by adding accessible ideas, processes and services, a role structure in accordance with the business needs.
Review our public Miro board on Data & Analytics Strategy to gain a deeper understanding of our vision and find valuable insights for your project.
Topics that we will study out
Strategy
During the course, you will look into the structure of a BI project and link it to business goals. You’ll learn how to analyze your company’s information needs. As a result, you’ll create a layout of a BI strategy relevant to your business and get a set of best practices for all project components: from techniques to organizational issues and PR.
Implementation
You will learn how to put a BI strategy into practice, transform it into an action plan and a list of initiatives for the year. We’ll discuss the prioritization of major changes and the concept of BI maturity, as well as how BI project leaders can develop and motivate themselves and their teams.
Efficiency
We’ll analyze what indicators should be monitored for operational control, service optimization and performance evaluation. You will learn what to include in KPIs and how to communicate your effectiveness to senior executives.
Who it’s for
BI group leader
BI Project lead, Head of BI, Head of Analytics – brothers and sisters – we stand or fall together
IT Director and Chief
Data officer
You need an intensive picture update, brand new ideas and a full vision
Senior BI
No monopoly on thinking
where we are and where to run – welcome
Operations director
If you’re responsible for BI project – don’t panic – that’s great!
Program modules
1 Analysis of business expectations and requirements
What are the main challenges confronting the business and its main divisions? What role do data and analytics play in solving these problems? This subject is addressed at the session, and the results of our preliminary audit are also presented
2 Critical analysis of what you have
You’ll perform an express analysis of the current ecosystem in order to bring you down to earth. The session includes brainstorming to develop your strengths. We also go into this issue while getting ready for the session. We provide the detailed results of our audit and bring everything into a single picture
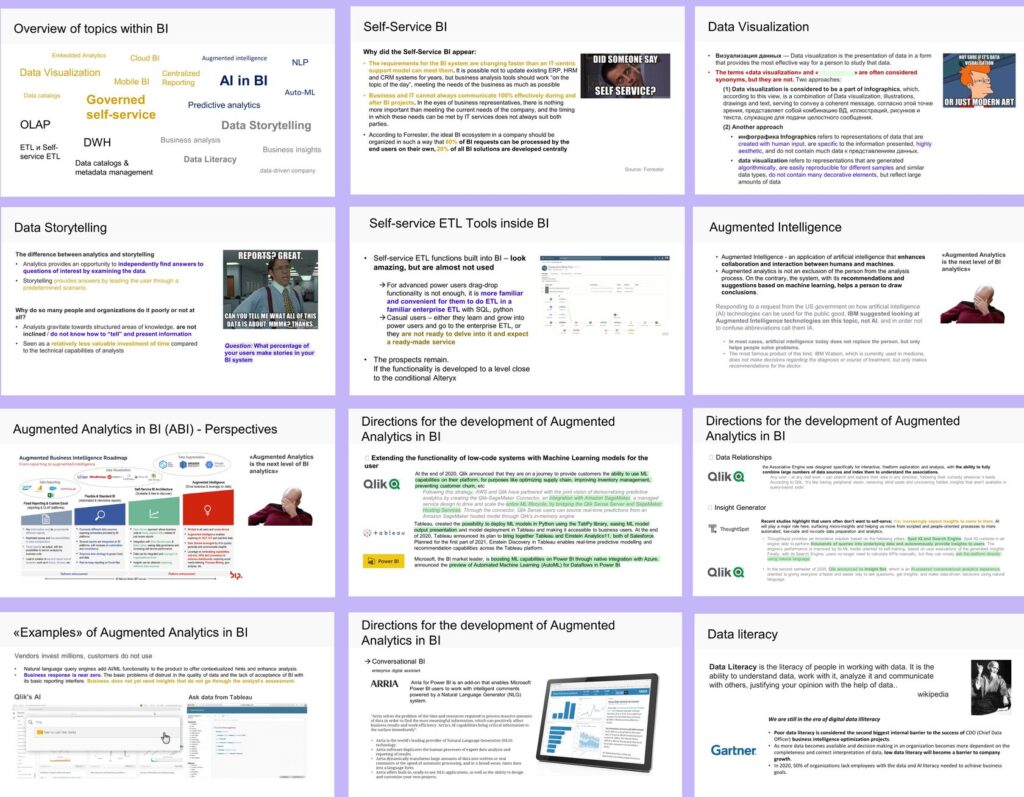
3 Information management landscape. Around and inside BI
- overview of BI bottlenecks and developmental crises in the company
- position of BI in the landscape of information management, BI connections with other disciplines: Data governance, Data Quality, Master data management, Metadata Management, Data warehousing, Data science and others
- more about basic topics inside BI: Self-Service BI, Data Visualization, Data Storytelling
- an overview of current trends in BI
- more about the basic topics of Self-Service BI, Data Visualization, Data Storytelling
4 BI goals in the company. Structure of BI strategy
- basic terms: BI, Strategy, BI-strategy, Self-Service BI, Guided BI, Dashboard, Information supply demand
- connection between BI and business strategy
- 9 sections of BI strategy: from Information role-based supply-demand to BI embedding
5 Self-Service & Guided BI governance models
- analysis of effective channels for creating and consuming analytics: within departments (Self-Service), centralized reporting teams (Guided / centralized analytics), Mixed / Delegated model
- differences between service models in terms of BI team structures, their catalog service and competencies
- critical analysis of analytics consumption patterns in the company by roles. Getting the balance.
6 Information role-based supply matrix
- communication between the BI project and business customers, Utility gap
- the role of data and analytics in solving business problems
- information role-based supply-demand
- ISD monitoring based on the current reports usage analysis
7 Data management
- what data to monitor, how to do it in an economical and targeted way
- data management for Guided and Self-Service data environment
- corporate data segmentation: business-critical data, personal and sensitive data, regular data
- master Data Source Management: identification, optimization and ownership of Master data sources
- data quality management: data quality control processes in sources, success of updating extracts and tables according to schedules, error notifications
- description of data sources
- questionnaire on data management processes crucial for BI
8 Content management
- content management: different approaches for Guided and SS
- separation of rights, validation, certification, promotion, archiving and content updates
- data stewards as an integral content management element
- analytical jobs
- a map of organization metrics and a description of business logic as part of the metadata governance framework
- report description: from creation and control to improvement and management of a metadata level accessible for business
9 Self-service BI: Data & Analytics culture
- implementation of BI Self-service: challenges and performance factors
- development of BI Community
- program of non-stop trainings and events: contests, BI doctor, BI / analytics day, etc.
- skill belts and assessment system
- champion development, mentoring
- report beautification service
- visual style guide: a collection of best practices for analytics visualisation
- announcements, success stories sharing, analytics blog/newsletter, FAQ, recordings and so on.
10 Guided analytics: User experience & Promotion
- user experience practices
- differences in approaches for Guided and SS
- service catalogue, interface where users can see what data/BI services they can get/order (with SLA and ticketing)
- navigation interface, reporting workplaces, search engine
- video guides on reports and feedback tool
- service desk support flows, SD Jira project
- development of communication channels for report delivery: email notifications, monthly digests, trainings, a database of video tutorials, onboarding new users, posts in corporate social networks, managers who personally participate in trainings and presentations
11 BI ecosystem tools
- BI in corporate messengers (Slack, Teams and others), systems and mobile devices
- development and maintenance of metadata management system
- creation and support of BI mailing lists: developing features for flexible standard and individualized pdf/ppt/jpeg mailing lists
- mapping tools: shared Excel files vs mapping web interfaces
- BI and Confluence friendship models
- coexistence of several BI systems within the company
12 BI Operations
- structures of the BI department: roles in the team, competencies of the BI analyst-developer, employee recruitment
- project management level: standard task management process, project cost estimation and forecast for new projects, visibility for customers leaders (Jira project boards)
- automated Access granting by roles: AD groups with autocompletion logic, role-based access matrix, visibility metadata by different data domains for row level security
- BI server administration routine
- license acquisition procedure: the logic of automatic seamless authentication including the provision of access to certain user groups
13 BI Efficiency
- KPI & Operational metrics: differences in approaches for Guided and SS
- service quality metrics: Satisfaction metrics, Response time analysis (based on Exchange stats and SD/Jira stats), Due date shifts (external SLA violation)
- BI adoption & efficiency tracking: Adoption metrics by key roles (% of engaged users, views per active user, active users and subscriptions), N of releases, notifications, Info demand coverage, Role coverage
- BI Server operational monitoring reports: Users & Reports with usage degrade, Report speed degrade controls, Extracts time controls, Service Availability
- report development: scheme of the full cycle of report development, report release checklists
- rules and standards: requirements gathering, backlog prioritizing, Email response time and templates, Testing and pear-reviews, onboarding newcomers to the BI team
14 Action plan, launching system changes and initiatives
- combining all elements of the strategy
- identification and prioritization of the main actions and projects by changes
- nuances of implementing changes in BI
- BI maturity concepts
- how the BI leaders can draw inspiration and motivate themselves and their team
- BI team workshops
Project Structure
Information request
(optional)
Information analysis about the current ecosystem of tools, reports, commands, tasks, projects, services, etc.
Interviews with business customers, IT and BI leaders
Determination of goals and expectations.
Getting feedback on the current state of the BI project
up to 10 days
Module customization
Undoubtedly, the strategy has its template. It has some theory and a lot of practice, which will be delivered to the participants.
But even before the session, it is more important to visualize the result and collect a draft. So, company-specific topics for brainstorming are often developed, and industry best practices are additionally dug up at this stage.
up to 10 days
Conducting a training
and facilitating session
It looks like a strat session for participants, but only about the data. The host presents the program according to the structure of information blocks and moderates modules with group discussions. The participants are a little alarmed by the relevance of the topics raised and get high on how cool everything sounds and how awesome it turns out.
2-3 days
Digitization of materials
Here we process the materials from the session, put the finishing touch to the texts, collect everything into a set of files.
We also write an action plan so that the company’s leaders could work with BI in future.
up to 10 days
Support
We communicate, share experiences and stories, write recommendations to each other, hug at conferences
Unlimited