Qlik Sense is a powerful data visualization tool that allows you to create interactive dashboards and reports. A well-designed dashboard can help users quickly understand complex data and make informed decisions. In this article, we’ll discuss some best practices for designing dashboards with Qlik Sense.
- Define the Purpose and Audience of the Dashboard
Before designing your dashboard, it’s essential to define its purpose and audience. Ask yourself questions like “What is the business problem that this dashboard is trying to solve?” and “Who will be using this dashboard?” This information will help you identify the most critical data points and design an effective dashboard layout.
- Use a Clean and Simple Layout
When designing your dashboard, use a clean and simple layout. Avoid cluttering the dashboard with too much information, which can overwhelm the user. Use white space to create a visual hierarchy and make it easier to read the dashboard. Remember, less is more when it comes to designing an effective dashboard.
- Use Consistent Colors and Fonts
Consistency is key when designing a dashboard. Use a consistent color scheme and font throughout the dashboard to create a cohesive look and feel. This will help users quickly identify different data points and make it easier to navigate the dashboard.
- Use the Right Chart Types
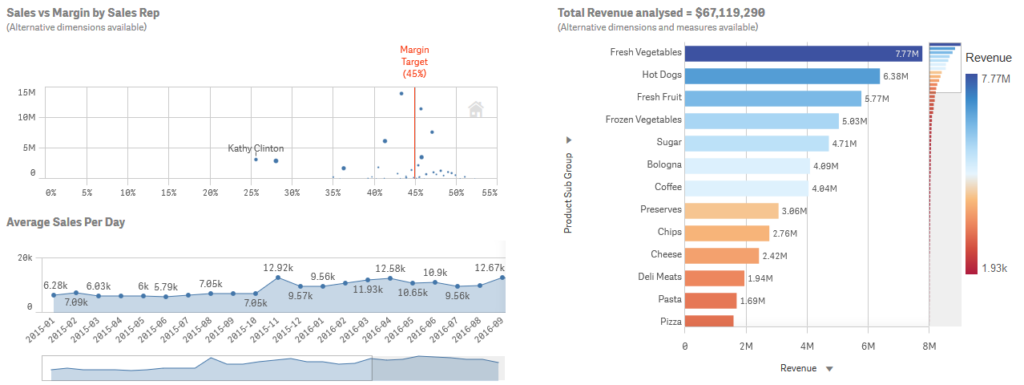
Choosing the right chart type is crucial for effective data visualization. Qlik Sense offers a variety of chart types to choose from, such as bar charts, line charts, and scatter plots. Use the appropriate chart type for the data being displayed. For example, use a bar chart for categorical data and a line chart for time-series data.
- Use Appropriate Filtering
Filtering is a powerful feature in Qlik Sense that allows users to explore and analyze data in different ways. Use appropriate filtering to help users find the information they need quickly. Use simple, intuitive filters that allow users to drill down and analyze data further.
- Use Appropriate Labels and Legends
Labels and legends are critical components of a dashboard. Use appropriate labels to provide context for the data being displayed. Use intuitive legends to explain what each data point represents. This will help users quickly understand the data being displayed and make informed decisions.
- Optimize Dashboard Performance
Optimizing dashboard performance is critical to ensure that the dashboard loads quickly and is responsive to user interactions. Use best practices, such as loading data from QVD files, to reduce data load times. Use appropriate data modeling techniques to reduce the number of data points being displayed on the dashboard.
- Test and Refine Your Dashboard
Testing and refining your dashboard is an essential step in the design process. Test your dashboard with different users and gather feedback to identify areas for improvement. Refine your dashboard based on user feedback and continue to iterate until you have a dashboard that meets the needs of your users.
Designing an effective dashboard with Qlik Sense requires careful consideration of purpose, layout, chart types, filtering, labels, and performance optimization. By following the best practices outlined in this guide, you can create a dashboard that provides valuable insights to your users and helps them make informed decisions based on data.