Uncovering market positions
Friends, today I invite you into the fascinating world of analytics, where we will use modern services to dive into a sea of data and uncover our bank’s position in the financial market. You will learn how internal indicators affect the share of the financial institution as a whole.
Let’s start with the analytics for the credit bureau, which has been around since 2004. At first it was a conventional credit bureau, where data on credit contracts was collected and standard credit reports were created. But as time went on, the information became more extensive and the ambition grew. It went through several stages of transformation and today this credit bureau has evolved into a real IT company. They are developing their own modules and services, and one of the first products was a visual analytics service, which I will talk about in a moment.
This service is a website divided into several blocks. The first block is the business and retail lending indicator. Here, members can access different reports depending on the subscription package they choose. In addition, the site provides free economic surveys, aggregated data from the national bank’s statistics and other sources, and research summaries. Today we will focus on two credit-related reports.
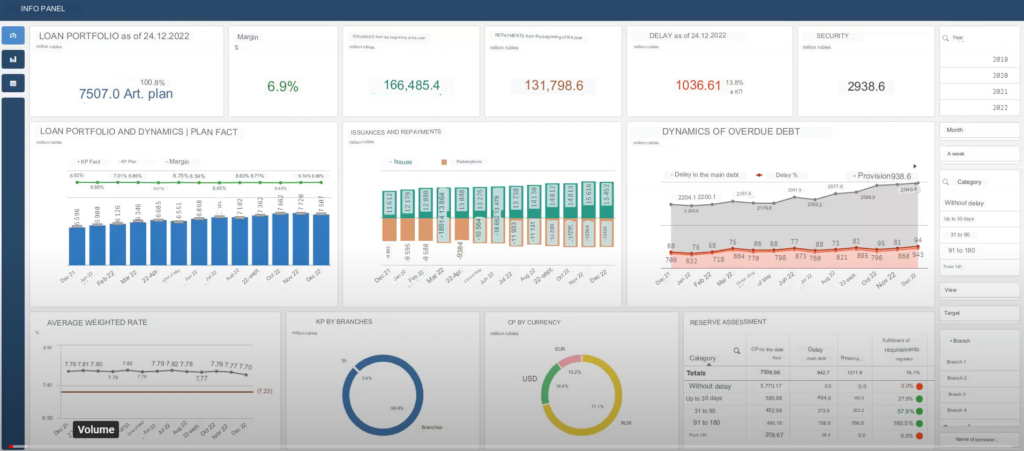
An important part of the analyst website is the portfolio report, which allows us to understand the key characteristics of our portfolio. The report is presented as four charts: average outstanding amount, number of active loans, number of borrowers and average loan amount. Each graph includes two elements: the total portfolio of all lending institutions, and an line showing the share of our financial institution.
Loan portfolio report
Continuing our journey into the world of analytics, we move on to the next part, which will cover important aspects of our loan portfolio. It’s important to note here that each financial institution has its own characteristics and you can’t compare banks specializing in mortgages with microfinance institutions providing payday loans. Our report give a picture of market share among other banks.
Going to the screen we discover the beauty of this report. Here you can select interbank information or pawnshop data and much more. It is important to note that the information provided to us reflects the entire market. The data system allow to apply various filters to better understand and analyze the market, even at a basic portfolio report level.
Let’s look at the example of car loans. If we specialize in this product, we would like to see how our market share changes in this area. In the report, we can select car loans and see our orange line growing steadily. Our market share has increased from 1.7% to 16.5%, which means that we are successfully gaining market share and standing out from our competitors. And this is not because other banks are pulling back and we are staying last. In fact, the market as a whole is growing and we are meeting the demand for car loans.
Flexibility in filters and going deeper into analysis
Let’s return to the possibilities for filtering data. Let’s say I want to study information about a specific region, such as Alabama. Here I have a lower share of the auto loan market than the average for the whole of America. By limiting the filters to just auto loans and the Alabama region, I get valuable information.
Our report also has the ability to analyze loans by their size, i.e. the amount of outstanding debt. I can select a category of loans under $1 million, $1 million to $1.5 million, or even over $100 million. This allows me to focus on the niche I want.
An important factor in the analysis is the term of the loan, i.e. the remaining duration of the contract. We take into account that some loans can be repaid early, so it is important to know the remaining term specified when I entered into the contract. For example, if I took out a mortgage for 20 years but repaid it in 7 years, we still take into account the original term – 20 years and the remaining time until the contract expires.
Also consider the availability of collateral and the possibility of restructuring the loan. There are various options here to draw conclusions which allow you to choose the specific segment in which your financial institution operates. For example, if you specialize as a microfinance institution only in microloans in two cities in Arkansas and Wisconsin, you can analyze changes in your share in this particular segment.
Deeper into regional market analysis
Using our analytics toolkit, you can explore business opportunities in other regions. For example, I want to find out about Montana: What loans are being taken and not taken there? By selecting filters you get all the information you need about the data portfolio in that region. You will be able to understand whether the market is growing or not, who is borrowing and for what terms and amounts. This baseline understanding will help you decide whether or not to continue your research in this region.
The second report we will look at is the report on loans disbursed. This is designed so that new users do not have to get used to a new interface every time. This report shows the number and amount of loans disbursed, the number of borrowers and other key indicators.
An important new feature is the ability to customize the filters in these reports. For example, you can exclude students or limit the display to seniors only. You can also specify a loan term range to see how many students are taking out loans for up to 6 months. You can also track changes in your market share and see that student demand for short-term loans is increasing.
The power of marketing analysis
Our toolkit allows you to select specific segments of data for further analysis. For example, we can research unsecured consumer loans in the Chicago region or in other regions such as NYC. In doing so, we can apply the ‘New Borrower’ filter to see those who are taking out their first loan in life. From this data we see that in April 2023, newcomers to the market have taken out loans totalling $53,000,000, while my share in this segment is only 0.44%. This is an obvious finding that I am not succeeding in attracting new customers who are just starting their credit history.
Our toolkit allows you to quickly track the effect of launched marketing promotions. For example, if I launched a promotion in January 2023 offering preferential terms for pensioners or invested in advertising, I can see the results immediately. It is not only the absolute numbers, but also my market share. For example, if the campaign has increased my lending share to 16.8%, it means that the campaign has been successful and continues to give me market share. I now control a quarter of that market, which exceeds my expectations.
Thanks to the analytical tools and performance indicators for marketing campaigns, I can make informed decisions and adjust my strategy. I can determine which marketing campaigns are producing maximum results and how successfully I am competing in the market. This allows me to identify the strengths and weaknesses of my business and improve my Data Driven strategy.
A variety of reports and their applications
Our service offers a variety of reports based on credit history. The options range from 9 to 15 to fit your needs precisely. There are reports specializing in legal entities, individuals or including both segments. This is important as each organization may target different markets.
Our service has reports to help you examine the gender and age structure of borrowers and compare it with the market. This is important to know if you are attracting the right audience. Maybe your niche is clients over 50, or maybe you want to attract younger people. We have all the reports you need so you can make an informed decision.
You’ll also find non-batch reports in our service, which are designed to meet specific needs. They were developed based on requests from financial institutions who wanted to see certain indicators. By not including them in the package, we have been able to keep the service affordable without increasing prices.
Ranking reports allow you to know your market share and compare your place with other financial institutions. If, for example, in November 2022 my share was 12%, it could mean that there are institutions with a 20% share or even a leader with 70%. This report helps you understand your position in the market and its dynamics.
Our service is based on real requests and feedback from clients. We understand that sometimes there are situations where the volume of leads grows but the market share does not change. In such cases, we provide reports that explain that the market as a whole is also growing and your competitors are also active. It is important to maintain your position and not to lose market share.
We offer you a variety of reports so that you can get all the information you need and make intelligently informed decisions for your bank.
Biometric analysis and photo quality
The bank has developed a unique biometric system that deservedly ranks among the top 20 systems in the world according to the American Institute for Technology Standards. This system is based on biometrics, including face recognition and other biometric parameters.
During the implementation of biometric systems in financial institutions, we encountered one important issue: photo quality. Over time, a large number of photos have accumulated, and while our system performs well and handles the task quickly, the quality of the images can have a significant impact on the results.
By performing the analysis, we get the distribution of photos according to different quality scores. For example, out of 10,000 photos, only 26 have excellent quality with a score from 91 to 100. The average score is 61 out of 100. These numbers help us understand how many photos require attention and additional measures to improve their quality.
It is very important to have a description of the specific photo files that need to be rephotographed. Such information helps us to identify the reasons for the poor quality and to take steps to improve it.
I have a special utility that allows me to identify specific photos that need to be rephotographed. I can also detect system errors that may be related to incorrect photography. For example, in 1,500 cases out of 10,000, the person’s left eye was closed, and this indicates that there is a problem in the photographic process.
Evaluating photos helps me understand which quality parameters are causing problems. For example, a neutral face without any emotion does not affect the quality much, but a cropped face is a critical factor. I’m also interested in finding out if there are repeating photos or masks which could indicate system errors.
The platform for bail auctions
Allow me to introduce you to our innovative platform for the sale of collateral auctions. This is where a bank puts up a package of debts and potential buyers, such as debt collectors, offer their prices for these portfolios. However, before we can sell a portfolio, we need to know what is included in it.
Due to the confidentiality of personal data, we cannot disclose specific details of each debtor. However, we can provide aggregated information about portfolios, such as collateral and loan portfolios, and auction types, including English, Dutch and closed formats.
The platform provides convenience for the seller. He can browse through buyers’ offers and choose the best one. The application process is also simplified – the seller fills in only a few basic fields, such as the contract number or customer number. The rest of the data is automatically downloaded from our internal resources, such as the credit bureau.
Once the full portfolio information is generated, we provide an overview of data such as a breakdown by borrower gender and age, amount owed, number of contracts and other key indicators. This information helps us understand the size of the portfolio and its characteristics.
Our analytics help us assess the market and understand, for example, that the size of the portfolio being sold is $19.7 billion and contains fewer than 10,000 borrowers. This indicates that large borrowers predominate among them.
Visualization and application of data
Thousands of large borrowers are located in the top right corner of our chart, highlighted in red. From these visualizations, I draw surprising conclusions about what interests me and what I should pay attention to.
We apply data visualization not only to our internal projects but also externally. We also have a number of projects at different stages of development that also use Qlik to monetise data, whether it’s our own or obtained from other sources.
One of the advantages of Qlik is its ease of use. You don’t need a license to access our resources and reports. You just get a login and password and all the information is available to you.
Why did we choose Qlik? During the selection of tools, we considered many options, including Tableau and others. However, Qlik stood out on a combination of factors and was chosen by us. And now we can see that this choice has justified itself.
The more we learn, the faster our reports load and the more efficiently we work with data visualizations.
We start the process of collecting data, the source of which is credit bureau. This is where we get credit history information from banks, pawnshops and other financial institutions, as well as government and state agencies that provide financial services.
We have access to an enormous amount of credit history data and external sources. Open data includes statistical information from the national bank and other sources. We aggregate them according to our current needs, looking for more detailed data when needed in mutually beneficial terms with other information providers.
We use powerful data visualization tools, such as Qlik, to process and present data. This helps us extract valuable information from vast amounts of data and make informed decisions.
Thanks to our analytics services, client can optimize processes within the bank, improve the quality of decisions made and increase staff efficiency.
We attach great importance to data security and ensure that it is protected against unauthorized access and leaks.
We are constantly improving our tools and services, taking into account changes in customer requirements and needs in order to stay ahead of the competition.
We demonstrate practical examples of using analytics services, showing their effectiveness and benefits for the bank.
We continue to develop new services, introduce innovations and build a Data Driven strategy for the bank. We are ready to take on challenges and solve complex problems with the help of analytics and the use of data.
All these components together form a powerful toolkit that helps the bank make informed decisions based on data and build a successful Data Driven strategy.