Vizlib is a collection of premium add-ons for Qlik Sense that supercharge data visualization and extend the capabilities of the platform. It offers a wide range of pre-built visualizations, features, and functionalities that empower users to create stunning and interactive dashboards with ease. Vizlib seamlessly integrates with Qlik Sense, enhancing the user experience and enabling organizations to maximize the value of their data.
Here are some of the key components of Vizlib:
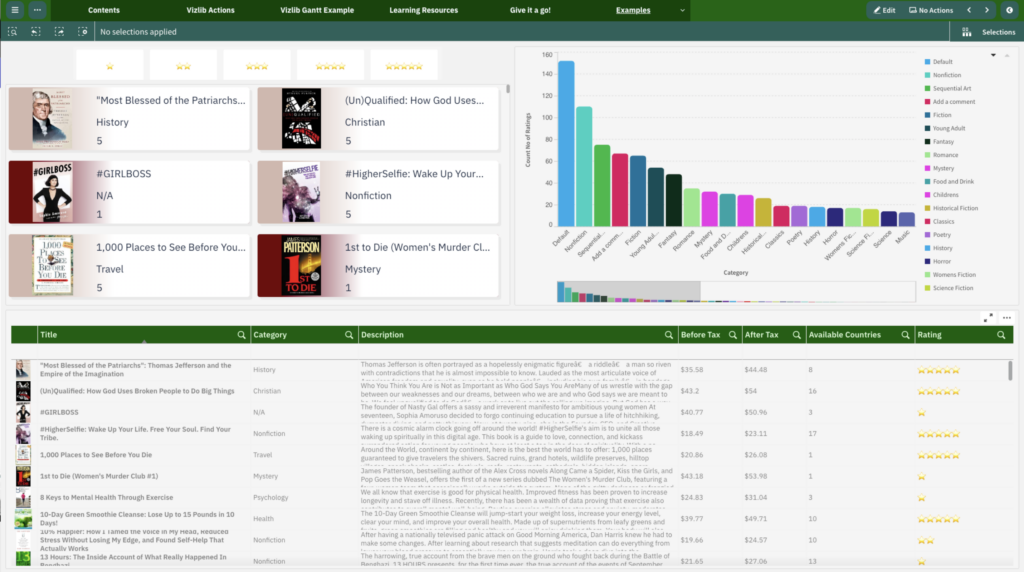
Vizlib Library
Vizlib Library provides a comprehensive collection of ready-to-use visualizations, including charts, tables, maps, and gauges. It offers a wide range of chart types, such as bar charts, line charts, scatter plots, and more, with extensive customization options.
Vizlib Collaboration
Vizlib Collaboration enables real-time collaboration and shared insights within Qlik Sense. Users can collaborate, annotate, and discuss data and visualizations directly within the dashboard, fostering collaboration and enhancing decision-making processes.
Vizlib Container
Vizlib Container allows users to create dynamic and responsive layouts within Qlik Sense. It provides advanced container objects that enable users to organize and structure their dashboards effectively, enhancing the overall user experience.
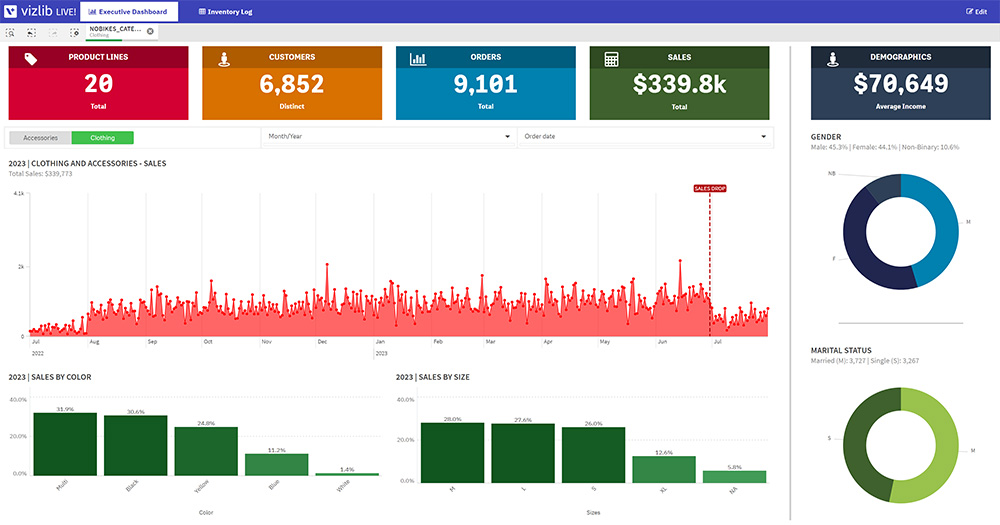
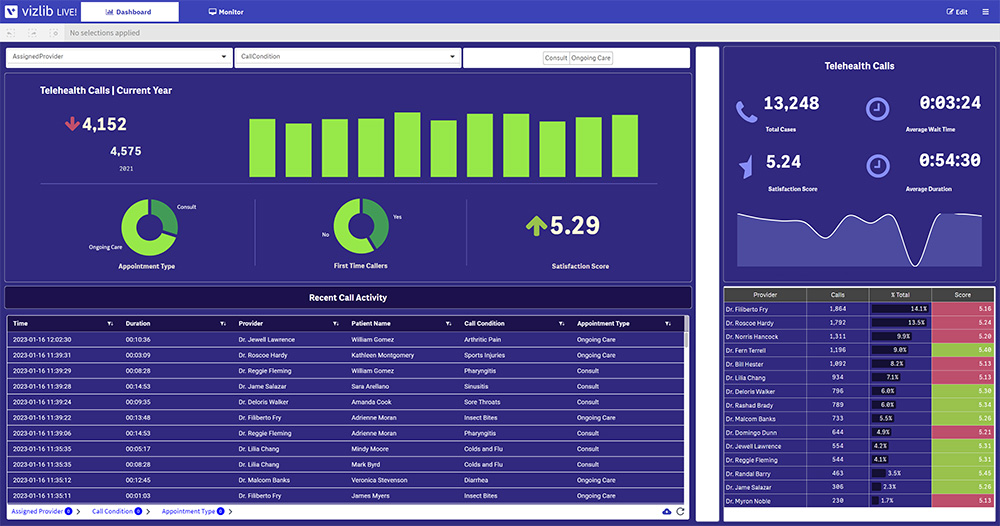
Vizlib Finance
Vizlib Finance offers specialized financial visualizations tailored for analyzing financial data. It includes financial charts, key performance indicators (KPIs), sparklines, and other visual elements designed to meet the specific needs of financial analysts and professionals.
Vizlib Collaboration & Narratives
Vizlib Collaboration & Narratives combines collaboration features with storytelling capabilities. Users can create guided narratives by adding annotations, descriptions, and commentary to their visualizations, making it easier to share insights and narratives with stakeholders.
Vizlib Writeback Table
Vizlib Writeback Table extends Qlik Sense’s capabilities by enabling writeback functionality. Users can add, edit, and delete data directly in a Qlik Sense table object, facilitating data entry and enabling data-driven collaboration.
Vizlib Pivot Table
Vizlib Pivot Table enhances the standard Qlik Sense pivot table by providing advanced features, flexibility, and interactivity. It allows users to dynamically explore and analyze data by pivoting dimensions and measures, creating calculated dimensions, and performing ad-hoc analysis.
Vizlib Value Driver Tree
Vizlib Value Driver Tree helps users understand the factors driving key performance indicators (KPIs) and performance outcomes. It visualizes hierarchical relationships between drivers and KPIs, enabling users to identify critical areas for improvement and optimization.
Advantages of Vizlib:
- Rich Visualizations: Vizlib provides an extensive library of visually appealing and highly customizable charts, graphs, tables, and maps. Users can effortlessly create captivating visualizations that effectively convey insights and engage stakeholders.
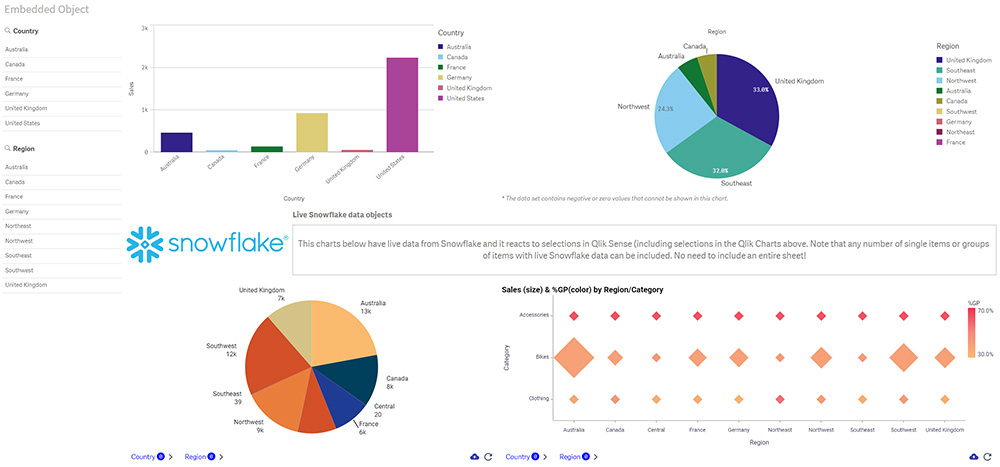
- Enhanced Interactivity: Vizlib add-ons enable advanced interactivity within Qlik Sense dashboards. Users can drill down, filter, and dynamically explore data, empowering them to uncover hidden patterns and make data-driven decisions.
- Scalability and Performance: Vizlib is built to handle large datasets efficiently. It leverages Qlik Sense’s powerful engine to deliver fast and responsive visualizations, even with complex data models and calculations.
- Customization and Personalization: Vizlib offers extensive customization options, allowing users to tailor visualizations to their specific needs. From color schemes to fonts and layout configurations, users have the flexibility to create unique and branded dashboards.
- Easy Integration: Vizlib seamlessly integrates with Qlik Sense, requiring no additional infrastructure or installation. Users can easily import Vizlib extensions and start utilizing them within their Qlik Sense environment.
Technical Details: Vizlib add-ons are built using modern web technologies and adhere to Qlik’s development standards. They are compatible with the latest versions of Qlik Sense and provide seamless integration with the platform. Vizlib extensions are designed to be lightweight, ensuring optimal performance and responsiveness even with large datasets. They offer a user-friendly interface that simplifies the creation and customization of visualizations, making it accessible to both novice and advanced users.
Vizlib add-ons for Qlik Sense unlock a world of possibilities when it comes to data visualization and analytics. By leveraging Vizlib’s rich library of visualizations, enhanced interactivity, and customization options, organizations can create powerful dashboards that drive data-driven decision-making. With its seamless integration, scalability, and performance, Vizlib empowers users to maximize the value of their Qlik Sense investment. Explore the world of Vizlib and elevate your data visualization game to new heights.