Egis is a global pharmaceutical company founded in 1907 in Hungary. The company is represented in more than 60 countries. It is one of the leading generic pharmaceutical manufacturers in Central and Eastern Europe. Its activities cover all the spheres of the pharmaceutical value chain.
EGIS is committed to the optimization of the production processes and significant improvement of the reporting quality. In order to achieve these goals we decided to implement a modern corporate data warehouse system (DWH) as well as to create analytical dashboards instead of the outdated reporting systems.
The prerequisites of our decision are the following:
- Scattered reporting information concerning the company’s activities, lack of a “one window” principle;
- Insufficient depth and variability of the available reports;
- Labour-intensive reporting processes (QlikView is extremely time-consuming);
- Lack of the online access to the reports.
The objectives of the planned improvements:
- Creation of the on-line operational reporting system covering the company’s activities aimed to support the decision-making management;
- Main requirements to the system: completeness and reliability of data, promptness of reporting, sufficient level of the granularity in Power BI.
The criteria of the project success:
- Availability of a confirmed operational report set (data and its visualization) required for decision making and monitoring of the current state and activities of the company;
- Creation of an efficient corporate data warehouse (DWH) environment with a finite number of data marts required for the correct functioning of the Power BI system;
- Availability of a Power BI tool intended for on-line “one-window” reporting in a consistent format;
- Ability of the users to work with the reporting system and its content.
The key functionalities of the system:
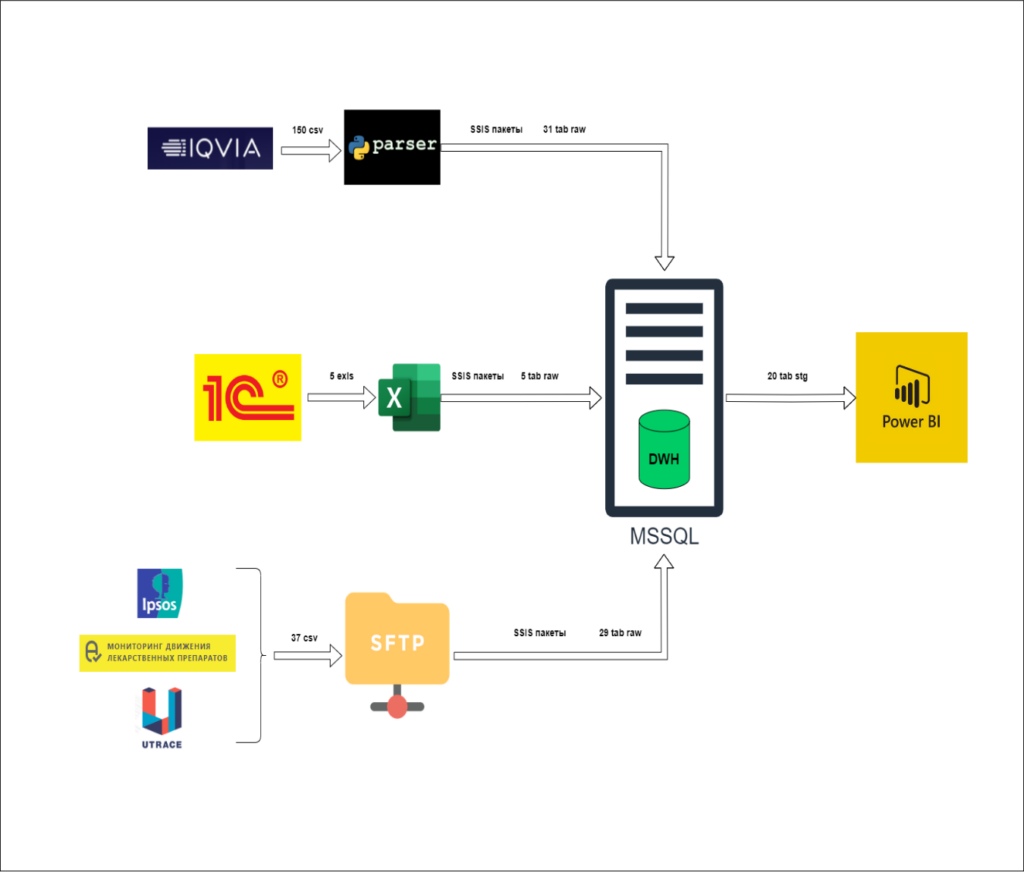
- Integration with external data sources: IQVIA (pharma sales data), Prindex (IPSOS) (pharmacist survey data), MDLP (public procurement data), MS SQL (internal company data), 1C (employee data), Excel (directories and plans);
- Authorization via Active Directory, including setting up of a role-based access control;
- Notifications concerning any failures of the corporate data warehouse sent to the administrator’s mail;
- Implementation of the data quality check rules;
- End-to-end filtering of the data by all the parameters. Selected filters can be applied to all the reports;
- Tracking of the dynamics of the indicators on a monthly or weekly basis in comparison with the previous year and the planned results;
- Detailed data analysis of all the key parameters and indicators such as sales, inventory, prices, etc;
- Clear, informative dashboards intended for the most widespread analyses such as brand or regional sales analyses;
- Real-time calculation of the key indicators such as sales dynamics, market shares, etc;
- “Drill-down” – step-by-step delving deeper into the data analysis, for example, going from total sales to sales of a specific medicine in a selected region;
- Integration of the Sell-In with Sell-Out data in order to analyze the efficiency of sales activities;
- Integration of CRM system in order to analyze the efficiency of medical representatives and their impact on the total sales
The key Blocks:
- Sales and demand analysis
- Monitoring of sales by product, region and customer. Key indicators: sales volume, dynamics, market shares;
- Demand and consumption analysis based on retail audit data. Estimation of real demand;
- Comparison with the sales plan. Control of the plan fulfillment;
- Analysis of the weekly sales dynamics. Identification of the trends;
- Usage of the predictive analytics models for sales forecasting
- Inventory management
- Monitoring of the inventory and stock balances kept in the warehouses;
- Analysis of the stock turnover. Optimization of the stock levels;
- Comparison of the stocks with the sales in order to identify possible imbalances.
- Analysis of the effectiveness of the promotional campaigns
- Evaluation of the results of marketing promotional campaigns. Analysis of sales growth;
- Calculation of marketing ROI
- Benchmarking and competitive analysis
- Comparison of the own positions with the competitors` ones. Analysis of the market shares and trends;
- Evaluation of own marketing and sales efficiency vs the competitors` ones. KPI benchmarking.
- Analysis of the competitors’ prices and product range. Evaluation of the pricing policy.
- Distribution efficiency analysis
- Monitoring of the distribution coverage and depth by customer and region;
- Analysis of the stock and sales comparison in order to clarify the distribution efficiency;
- Identification of the gaps in distribution and detection of the opportunities to expand the coverage.
The key changes made within the project:
- Addition of the Microsoft Power BI;
- Elimination of the QlikView;
- Elimination the NPrinting;
- Creation of the staging and the production corporate DWH environment
3 levels of MS SQL Server data processing:
- level of data porting from external and internal sources;
- level of the views creation for the preliminary data selection;
- writing of the tables into the corporate storage database with a relevant prefix for direct access from Power BI.
Thus, the implementation of a modern BI system based on a DWH has significantly expanded the company’s analytical capabilities and improved the efficiency of the decision-making management.