Introduction:
- Tableau Server stores all information about itself in a PostgreSQL database. It is possible to connect to this database.
- The problem of Tableau Server performance analysis is actual and there are a lot of open-source solutions. However, most of them contain incomplete information.
Our solution:
- Is a ready-made boxed solution;
- Added ‘Permission Matrix’ dashboard, which is the ‘pearl’ of the whole solution. There is not a single full-fledged analogue on the Internet, and those that exist are only a superficial image of what we have.
- The solution fully covers all the needs of Tableau server administrators;
- The solution works for any organisation that has Tableau Server installed;
Dashboards:
Basic information – Dashboard contains statistical information about server metrics, such as the number of views, logins and their changes. It helps to determine the degree of user involvement in the server, it also shows the ranking of the most popular data sources and the most active users. Also on the seasonality graphs you can highlight the relationship with the dynamics of actions.
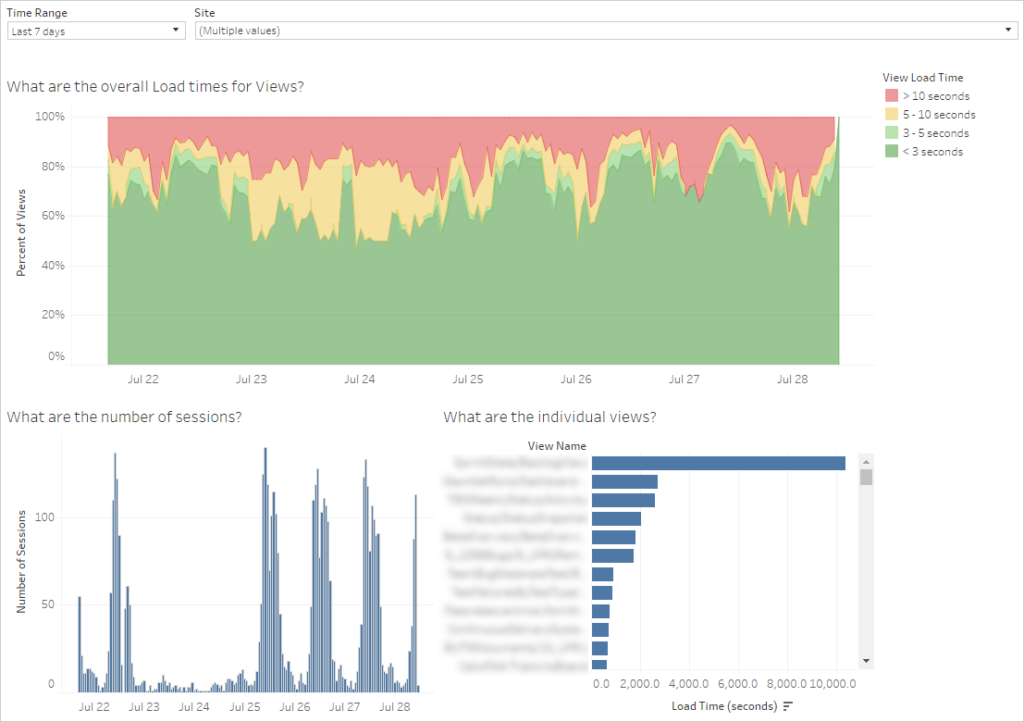
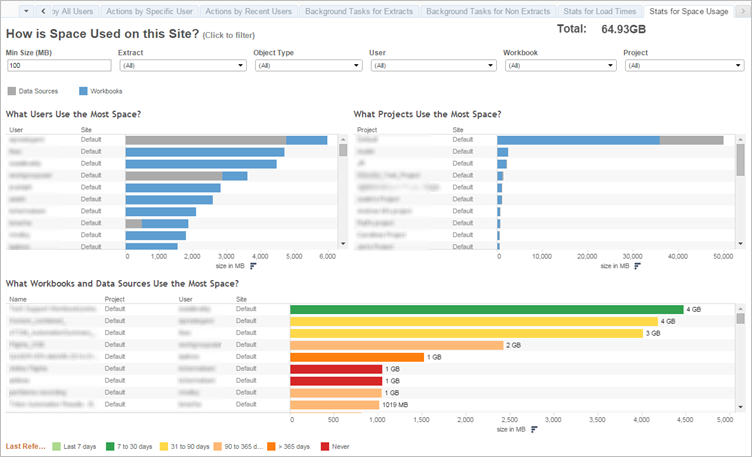
Technical information – This is the most technically important information about the load of visualisations and extracts, as well as their efficiency and RAM consumption. With the help of this, the system administrator will be able to promptly notice malfunctions and determine their causes.
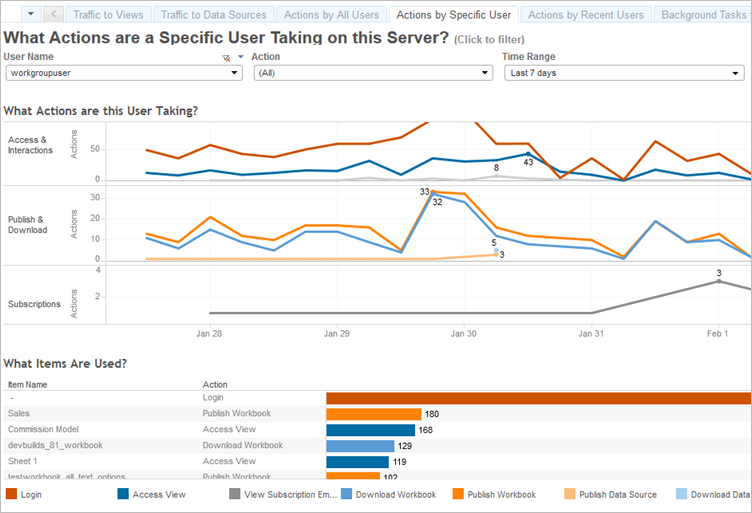
Permissions Matrix – The Dashboard contains information about user access rights for specific entities (projects, applications and others), which presents significant advantages in the area of user administration – in restricting and granting accesses to see how actions on the server are mapped to them.
Due to the complexity of permissions and rights management, problems arise – a user can see and interact with entities that they should not and vice versa – for example, accidentally deleting a folder or application on the server, which cannot be restored due to the fact that they were not allowed to do so. Properly mapped permissions will eliminate this and help the administrator manage access rights.
Target Audience:
companies that implemented Tableau at least a year ago and have 50+ users.
Users of the app:
Tableau server administrators who regulate the Tableau server.
Why you need the app:
it allows you to monitor Tableau server performance and respond to any administration issues that arise in a timely manner.
Advantage of the application:
it is a complete replacement for one of the elements of Server Management Add-On + Permission Matrix (solves the problem of misallocation of access rights to different people).
News Reflection in Tableau’ boxed solution
The task was to show the top 15 most important news in real time. That is, the user should see the actual news at any moment in time with the ability to view a screenshot of that news from the source.
As a solution, a web page was made that displays 15 blocks, each block containing only one news item with detailed information, with a refresh rate of once a minute and a web page refresh rate of once every 5 minutes.
Technical details: the solution is hosted on a single machine (Tableau Server, web server and script for updating data), it is enough to create a template for one news item (the other 14 items are customised through filters) and uses a customised Tableau and JavaScript integration.